

DAS
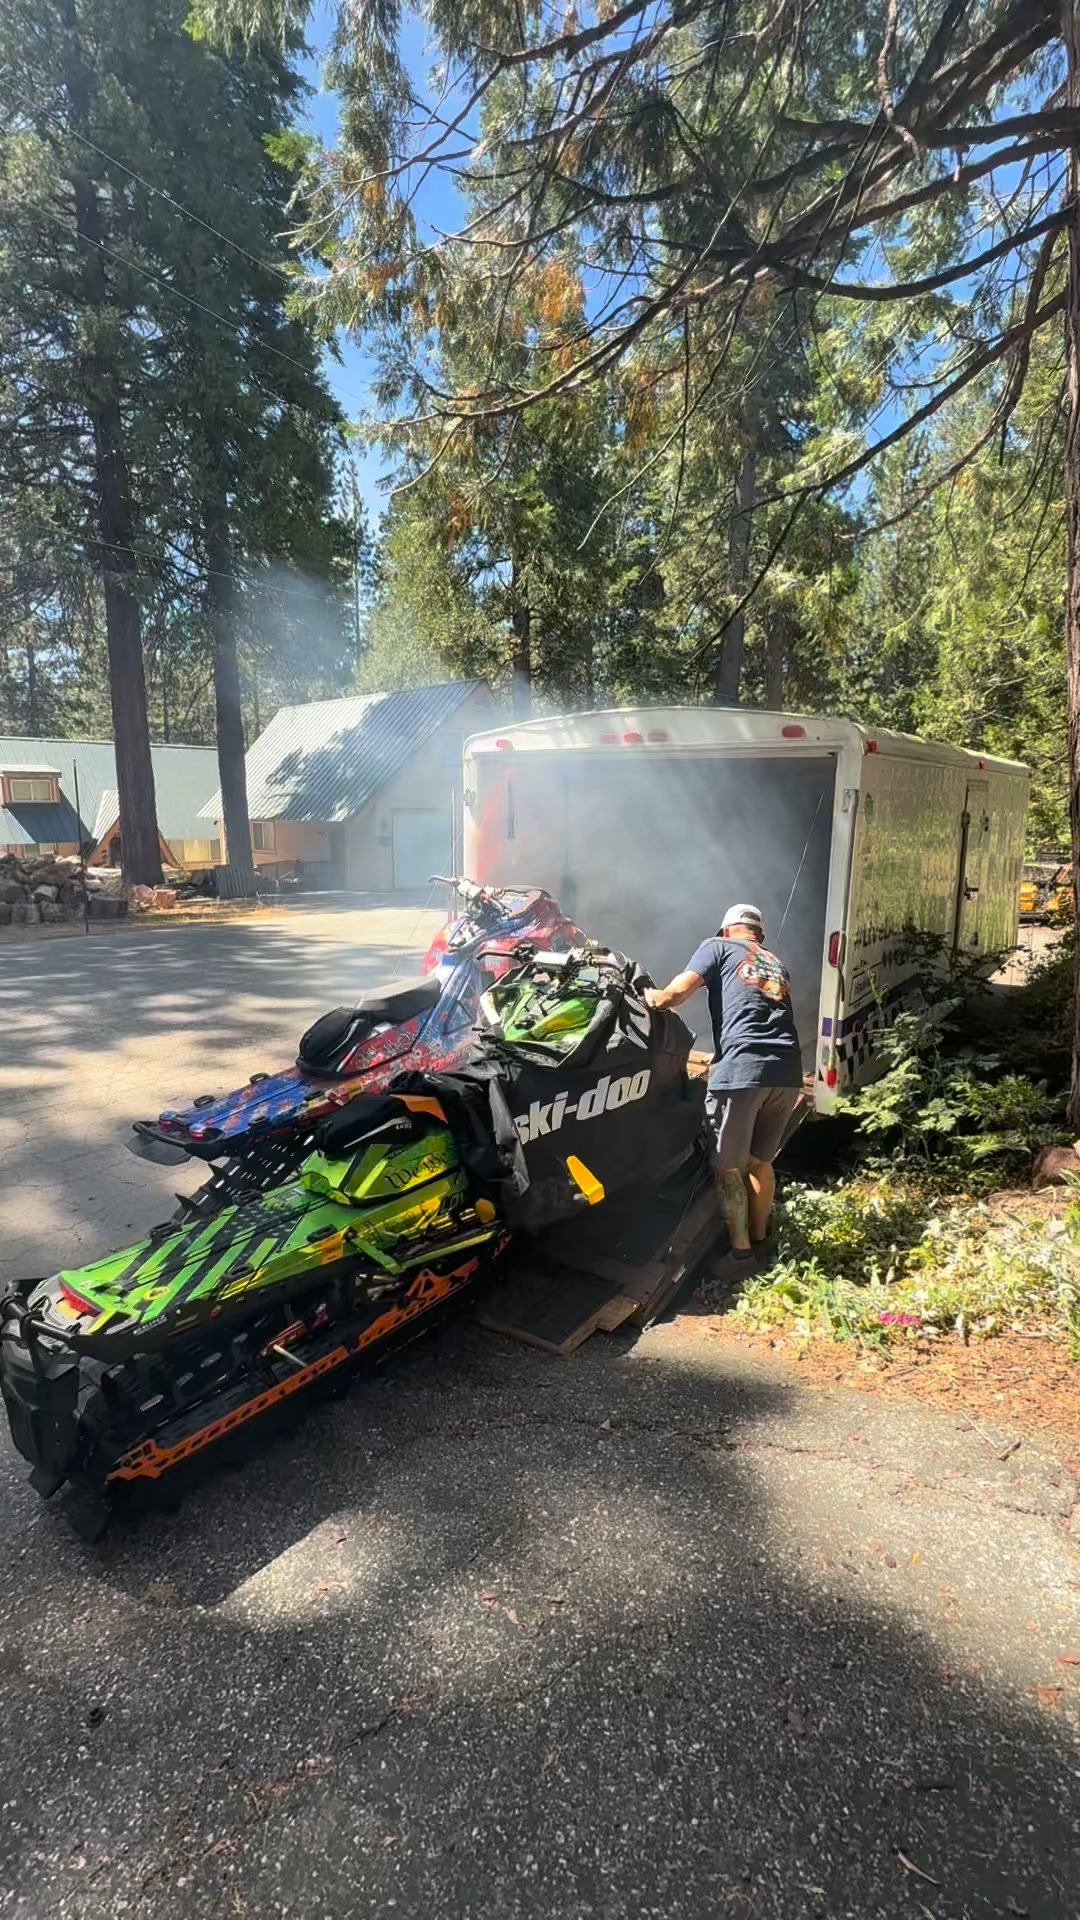
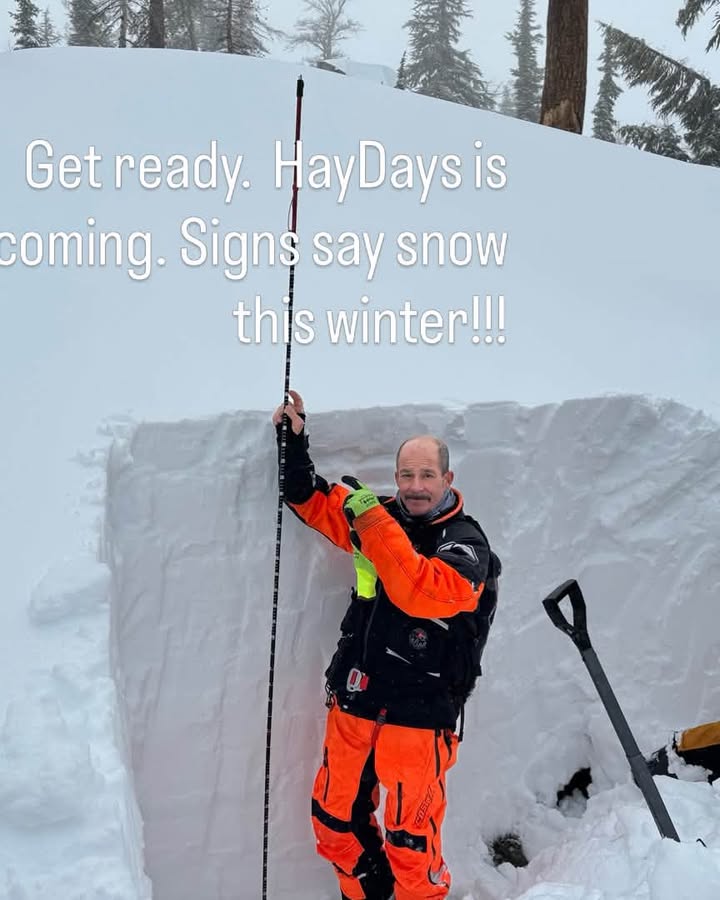
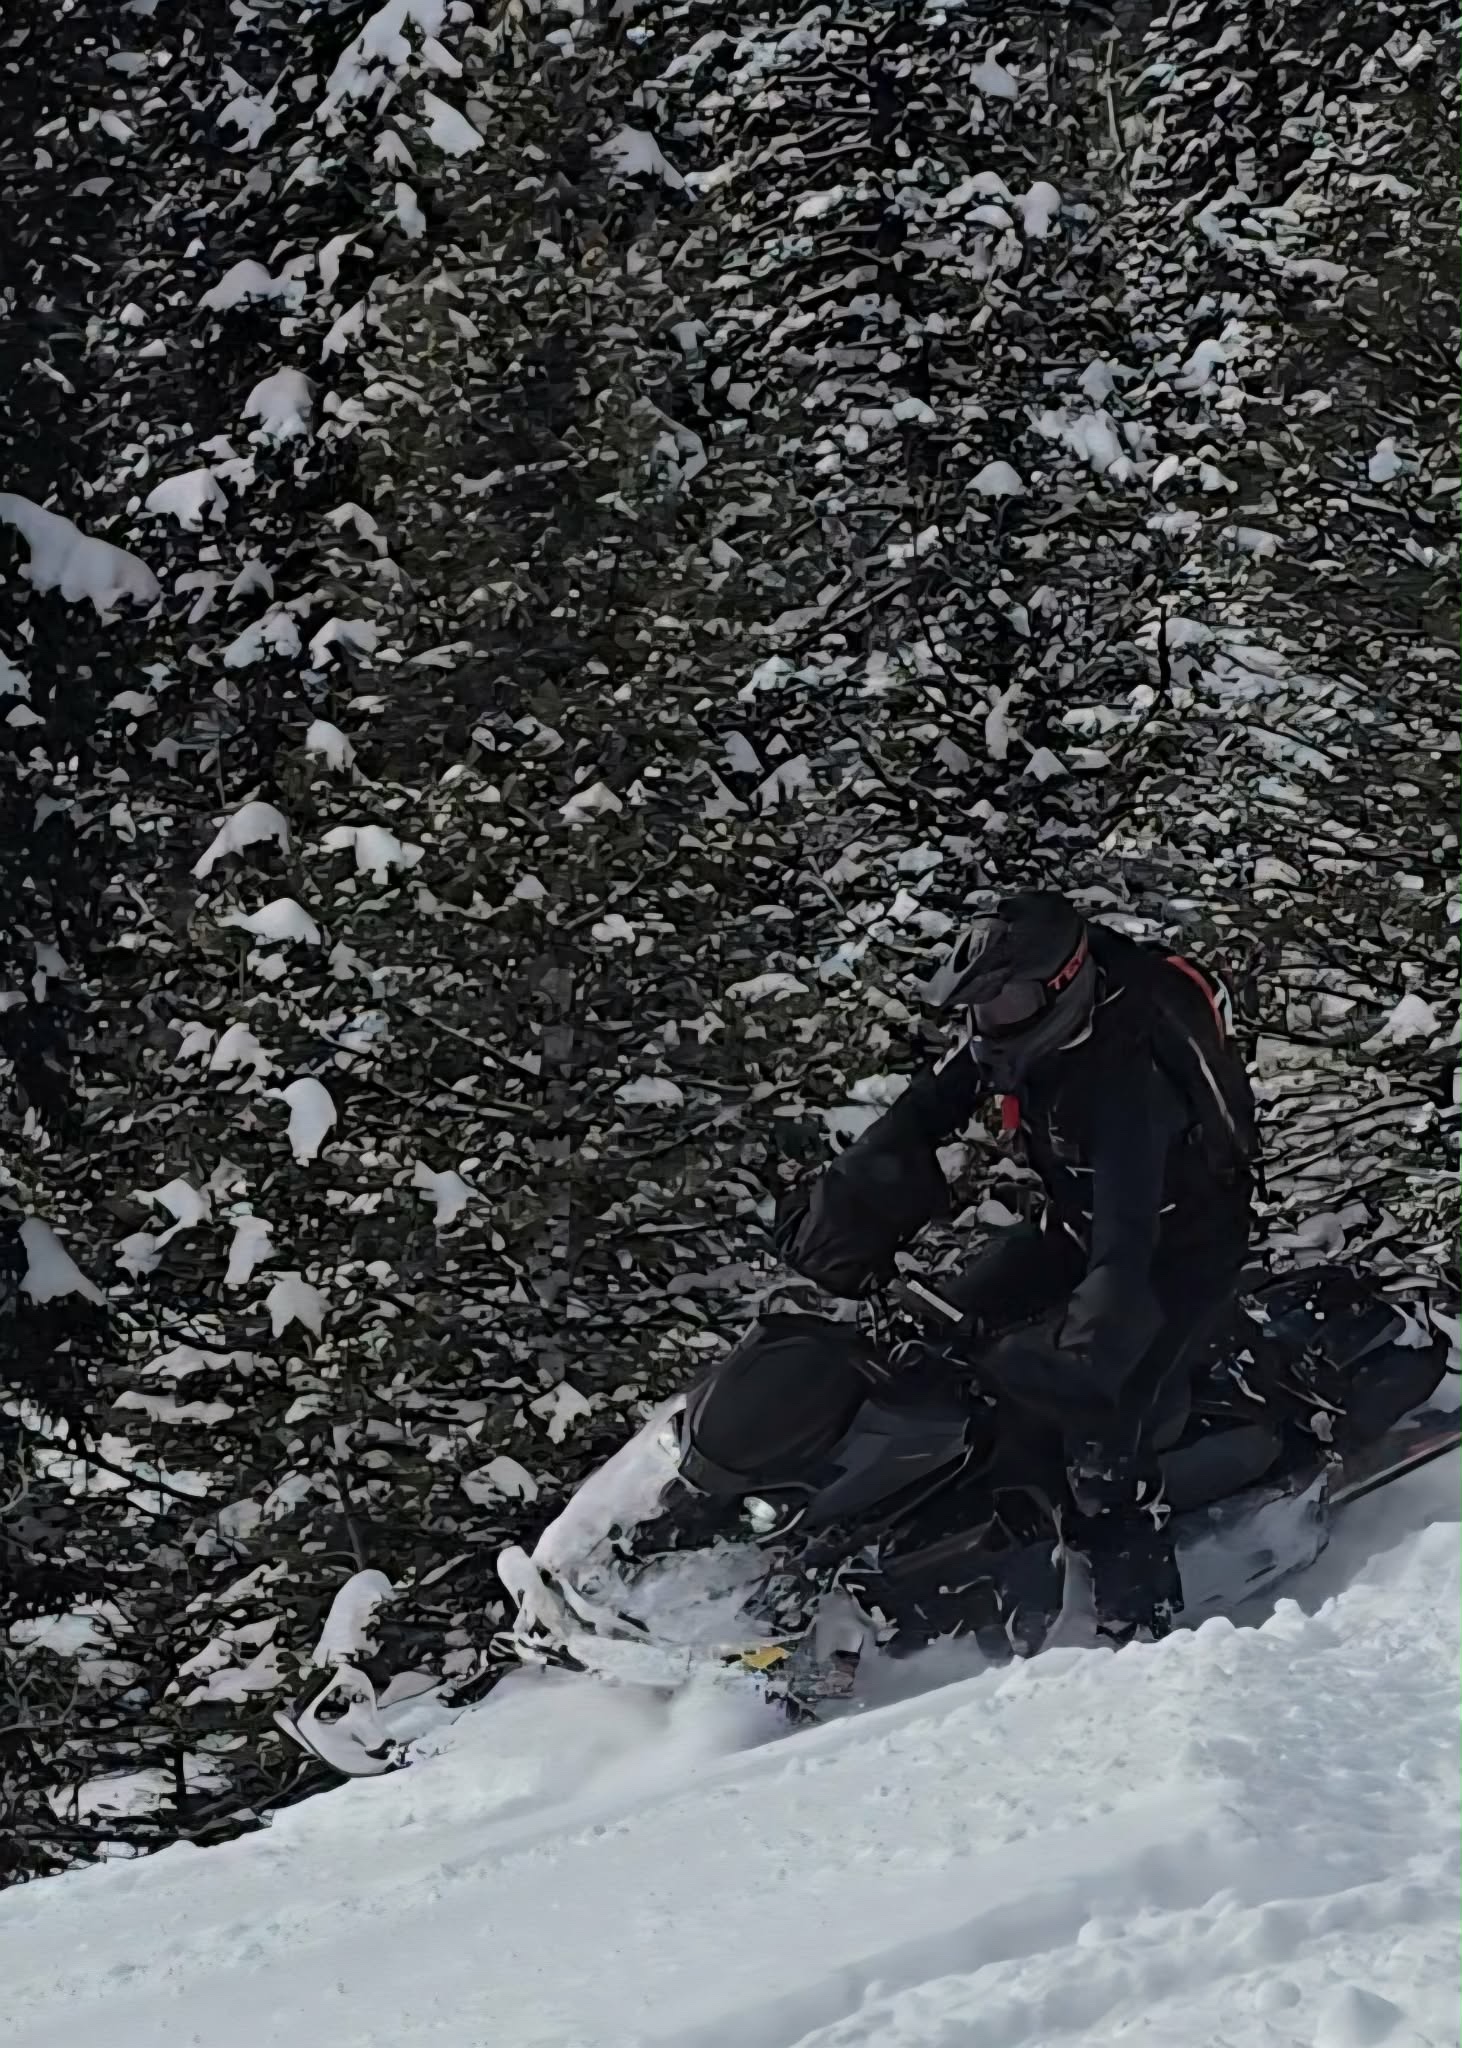
Nina Clifton is an AIARE Certified Course Leader, avalanche instructor with Sierra Avalanche Center, Bridgeport Avalanche Center & Ride Rasmussen Style, and a guide/snowmobile instructor with Ride Rasmussen Style. A founding board member, Treasurer & Secretary of Lake Tahoe Snowmobilers, Nina rides 100+ days each season and has a highly engaged reach within the snowmobile community. As a female rider and educator, she brings an authentic voice to the sport.
Disciplines
Brand
Ski-Doo
Years
9
Home Spot
Lake Tahoe & Island Park ID
Level
10
Pro
Total XP
18,400
earned
Badges
1
of 23
Campaigns
0
completed
5.4K
Total followers
2.3%
Avg engagement
6
Platforms
1.9K
Total views (recent)
629
Avg views
0.4
Avg shares
0.1
Avg saves
1.5K
Reach (28d)
Follower & engagement trend
Follower count and engagement rate over the same period — compare the shape of the two lines.
2 active partnerships
Pro 2
AIARE · Pro 2 · 2025
Create a free brand account to pitch Nina Clifton.
Get started freeWeekly averages over the dates shown. Followers are plotted from zero, so the line’s height tracks the actual count; engagement rate is zoomed to its own range, so small moves stay visible. Each panel’s axis endpoints are printed beside it — the two do not share a vertical scale.
Audience demographics
Age
Gender
Top countries
2.9K
Total views (recent)
1.5K
Avg views
Follower & engagement trend
Follower count and engagement rate over the same period — compare the shape of the two lines.
Weekly averages over the dates shown. Followers are plotted from zero, so the line’s height tracks the actual count; engagement rate is zoomed to its own range, so small moves stay visible. Each panel’s axis endpoints are printed beside it — the two do not share a vertical scale.
1.7K
Total likes
25.4K
Total views (recent)
1.3K
Avg views
0.9
Avg shares
Follower & engagement trend
Follower count and engagement rate over the same period — compare the shape of the two lines.
Weekly averages over the dates shown. Followers are plotted from zero, so the line’s height tracks the actual count; engagement rate is zoomed to its own range, so small moves stay visible. Each panel’s axis endpoints are printed beside it — the two do not share a vertical scale.
3.0K
Total views (recent)
1.5K
Avg views
Follower & engagement trend
Follower count and engagement rate over the same period — compare the shape of the two lines.
Weekly averages over the dates shown. Followers are plotted from zero, so the line’s height tracks the actual count; engagement rate is zoomed to its own range, so small moves stay visible. Each panel’s axis endpoints are printed beside it — the two do not share a vertical scale.
474
Total views (recent)
474
Avg views
Follower & engagement trend
Follower count and engagement rate over the same period — compare the shape of the two lines.
Weekly averages over the dates shown. Followers are plotted from zero, so the line’s height tracks the actual count; engagement rate is zoomed to its own range, so small moves stay visible. Each panel’s axis endpoints are printed beside it — the two do not share a vertical scale.
690
Total views (recent)
58
Avg views
Follower & engagement trend
Follower count and engagement rate over the same period — compare the shape of the two lines.
Weekly averages over the dates shown. Followers are plotted from zero, so the line’s height tracks the actual count; engagement rate is zoomed to its own range, so small moves stay visible. Each panel’s axis endpoints are printed beside it — the two do not share a vertical scale.