

DAS
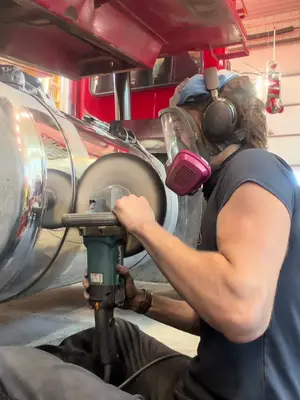
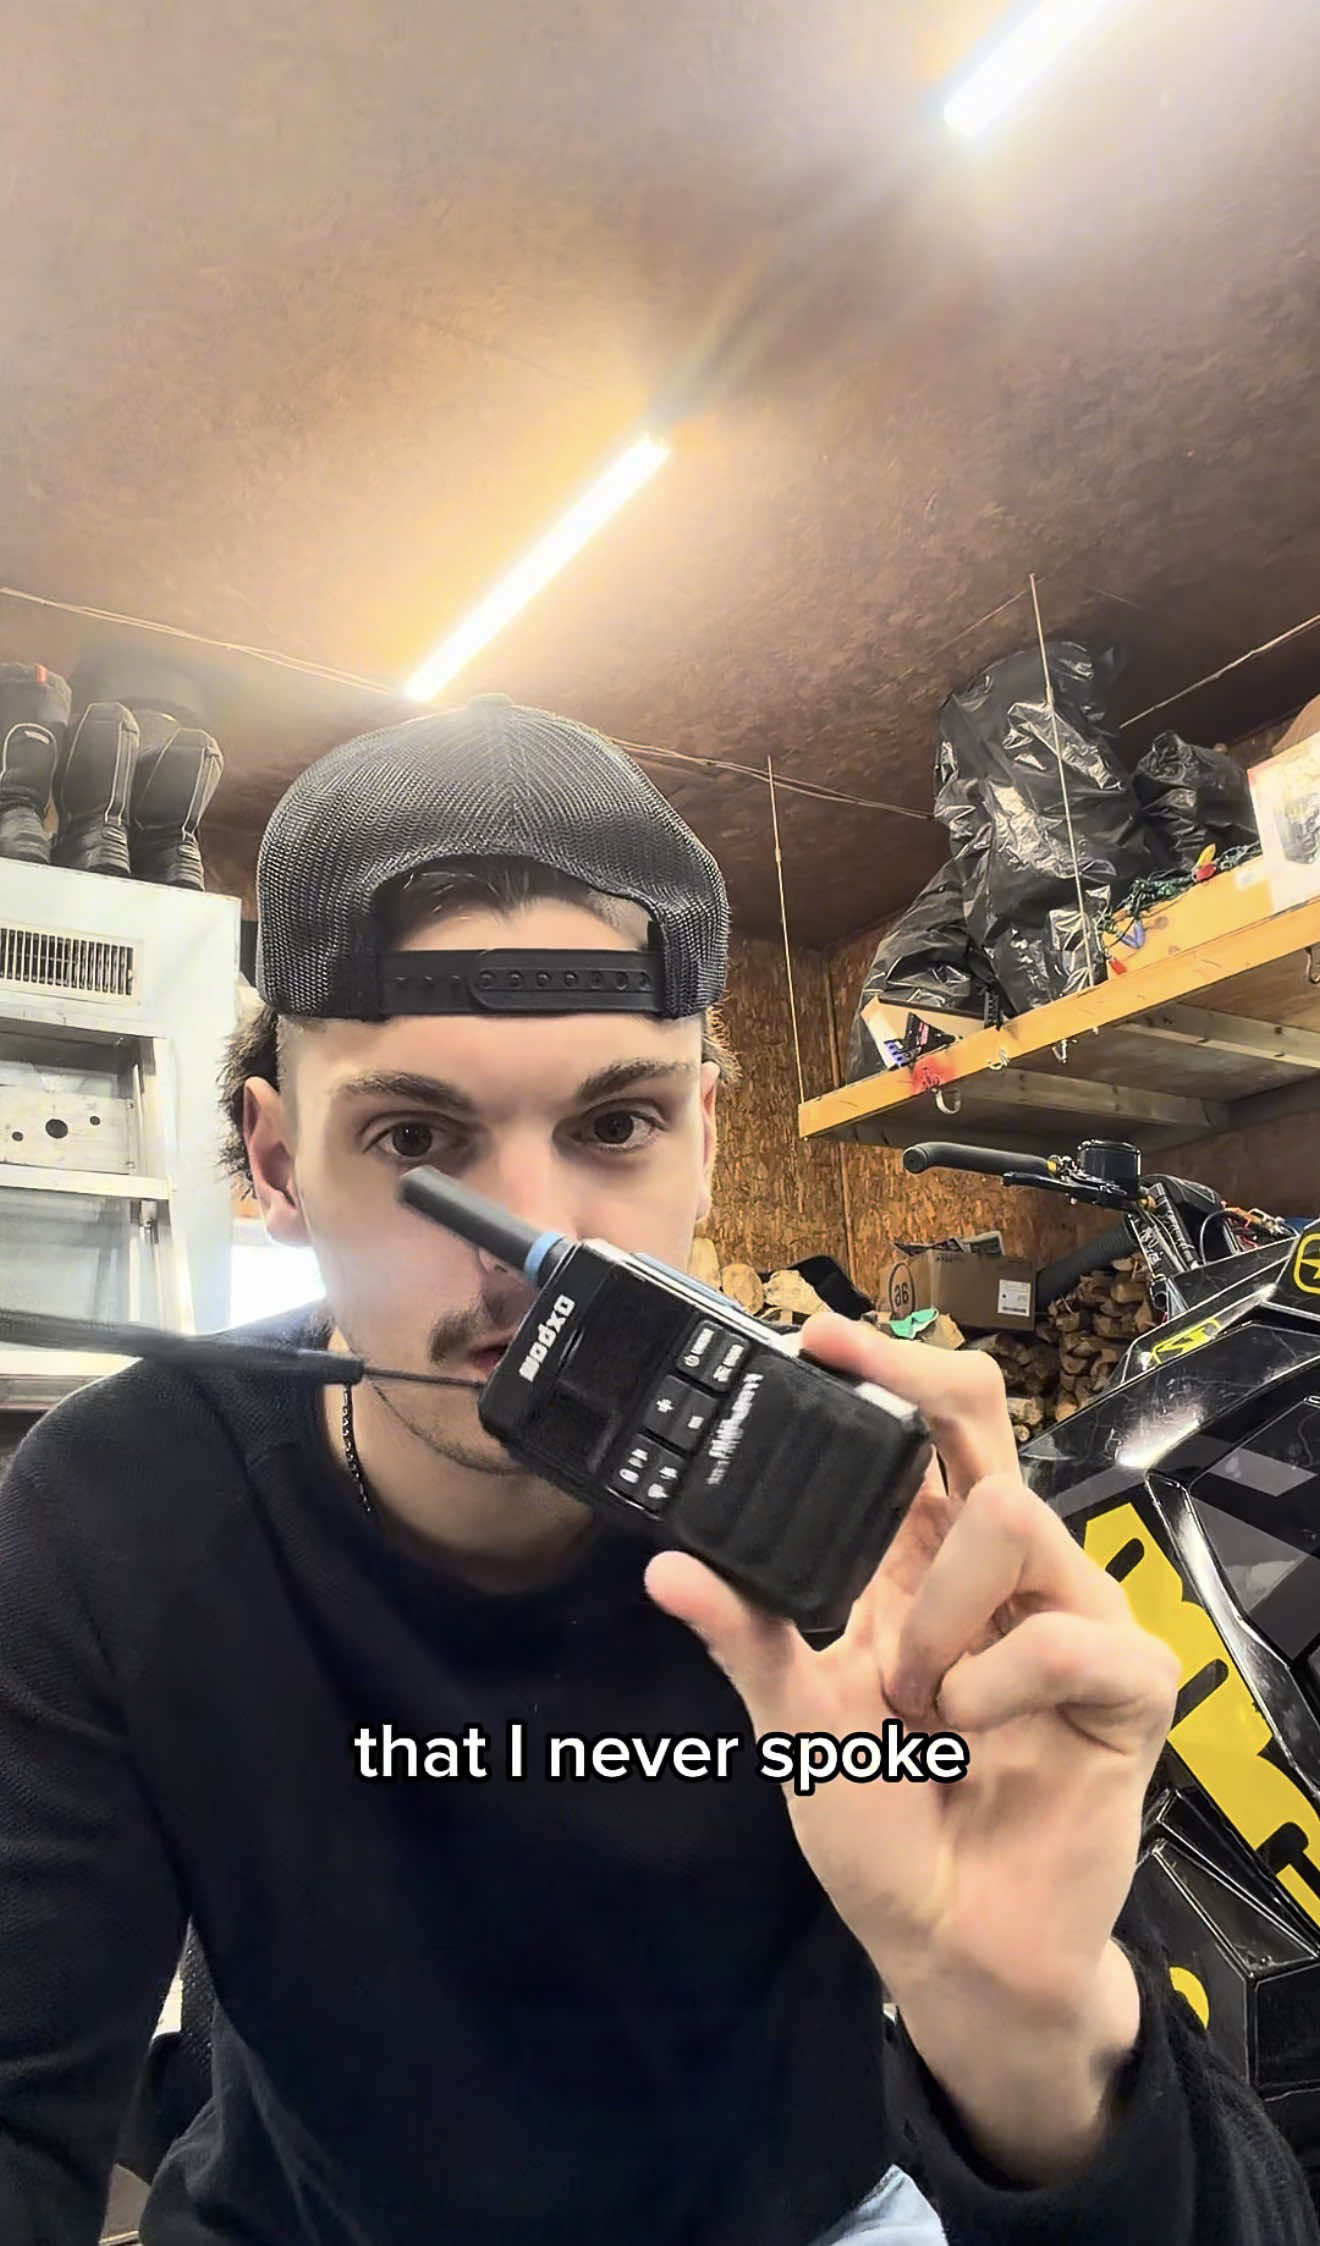
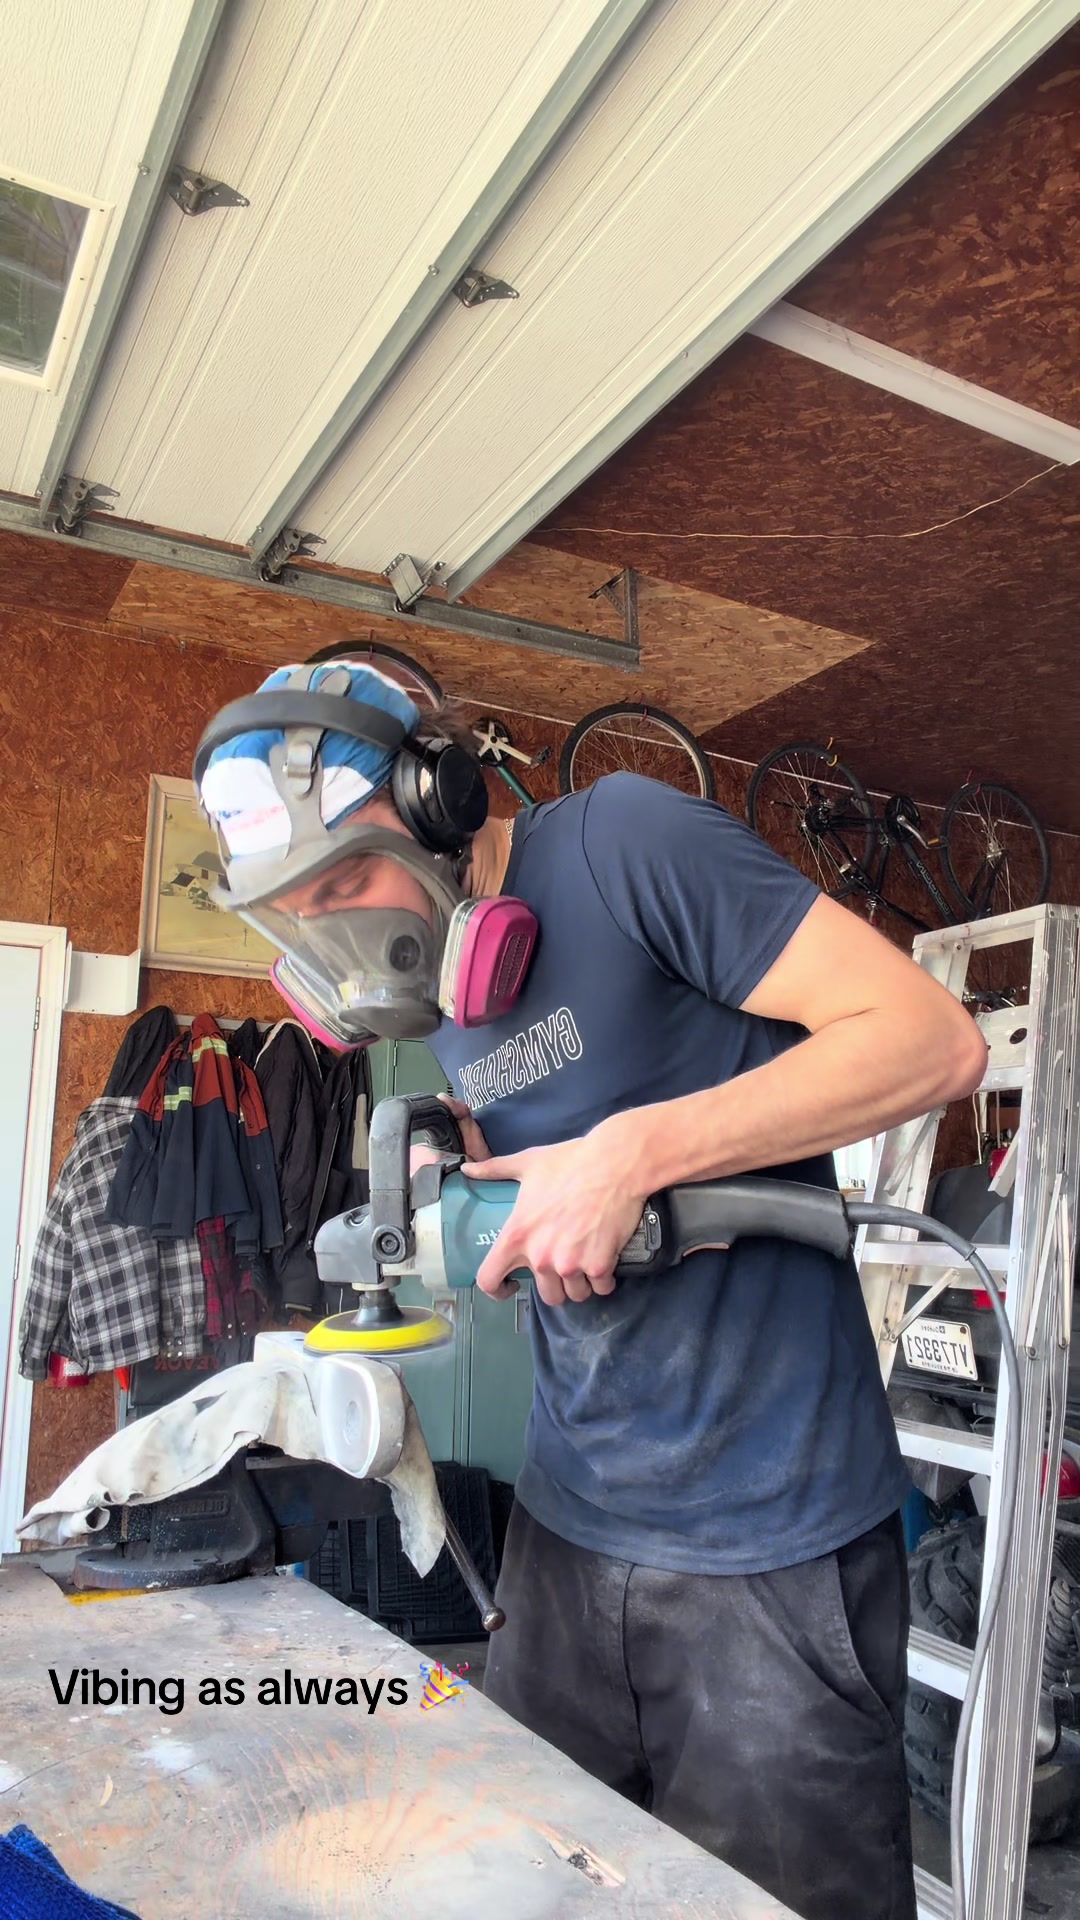
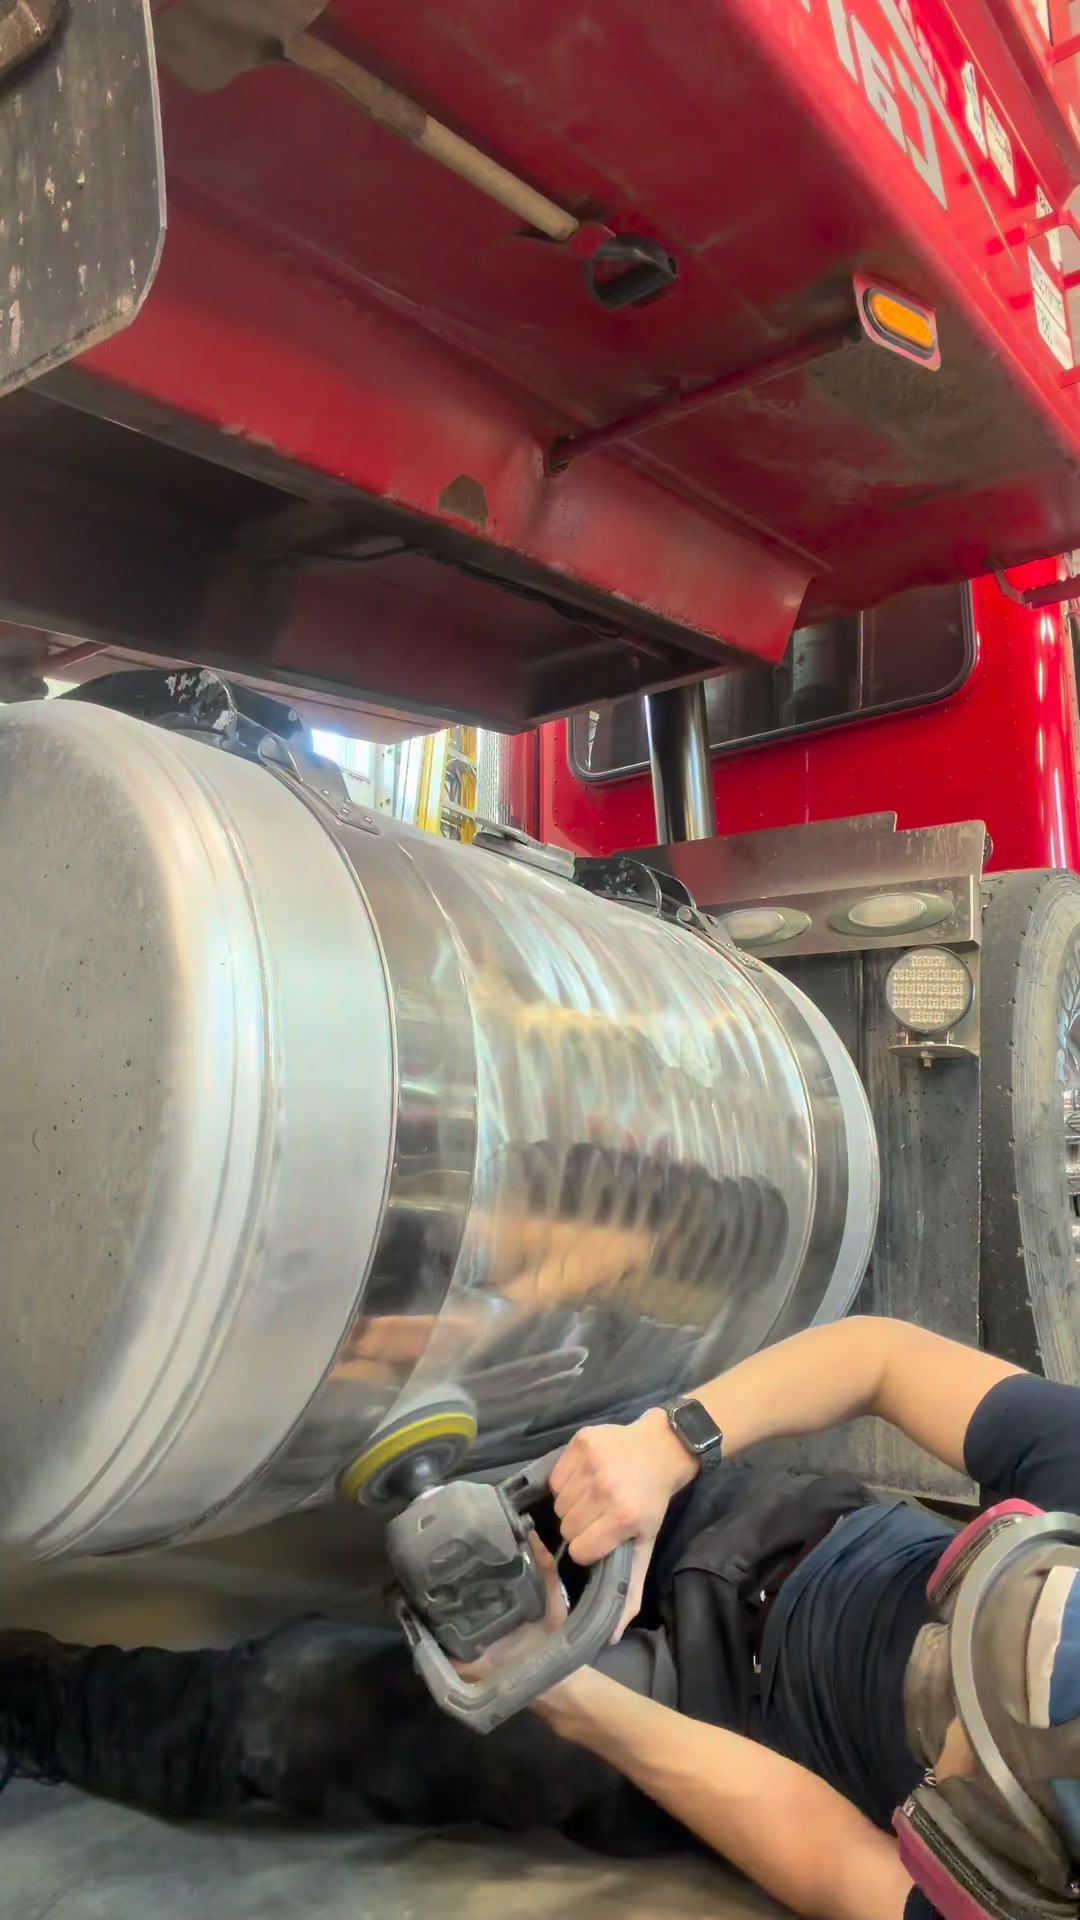
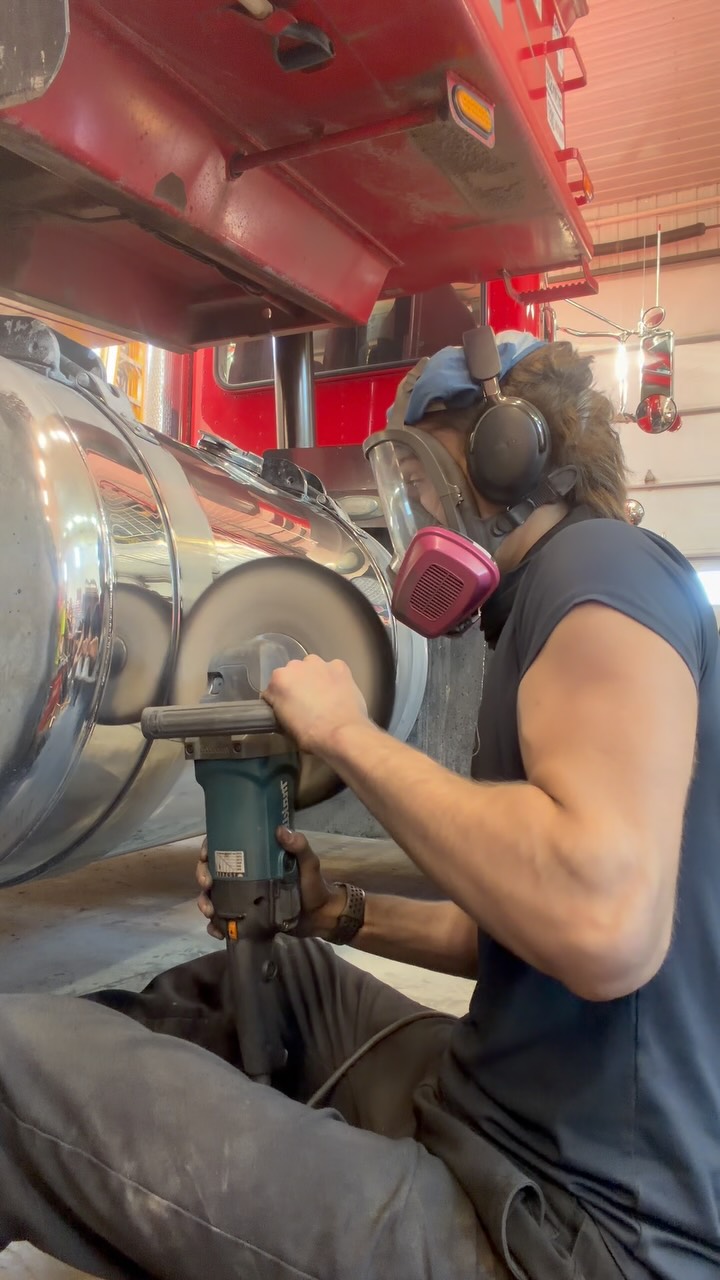
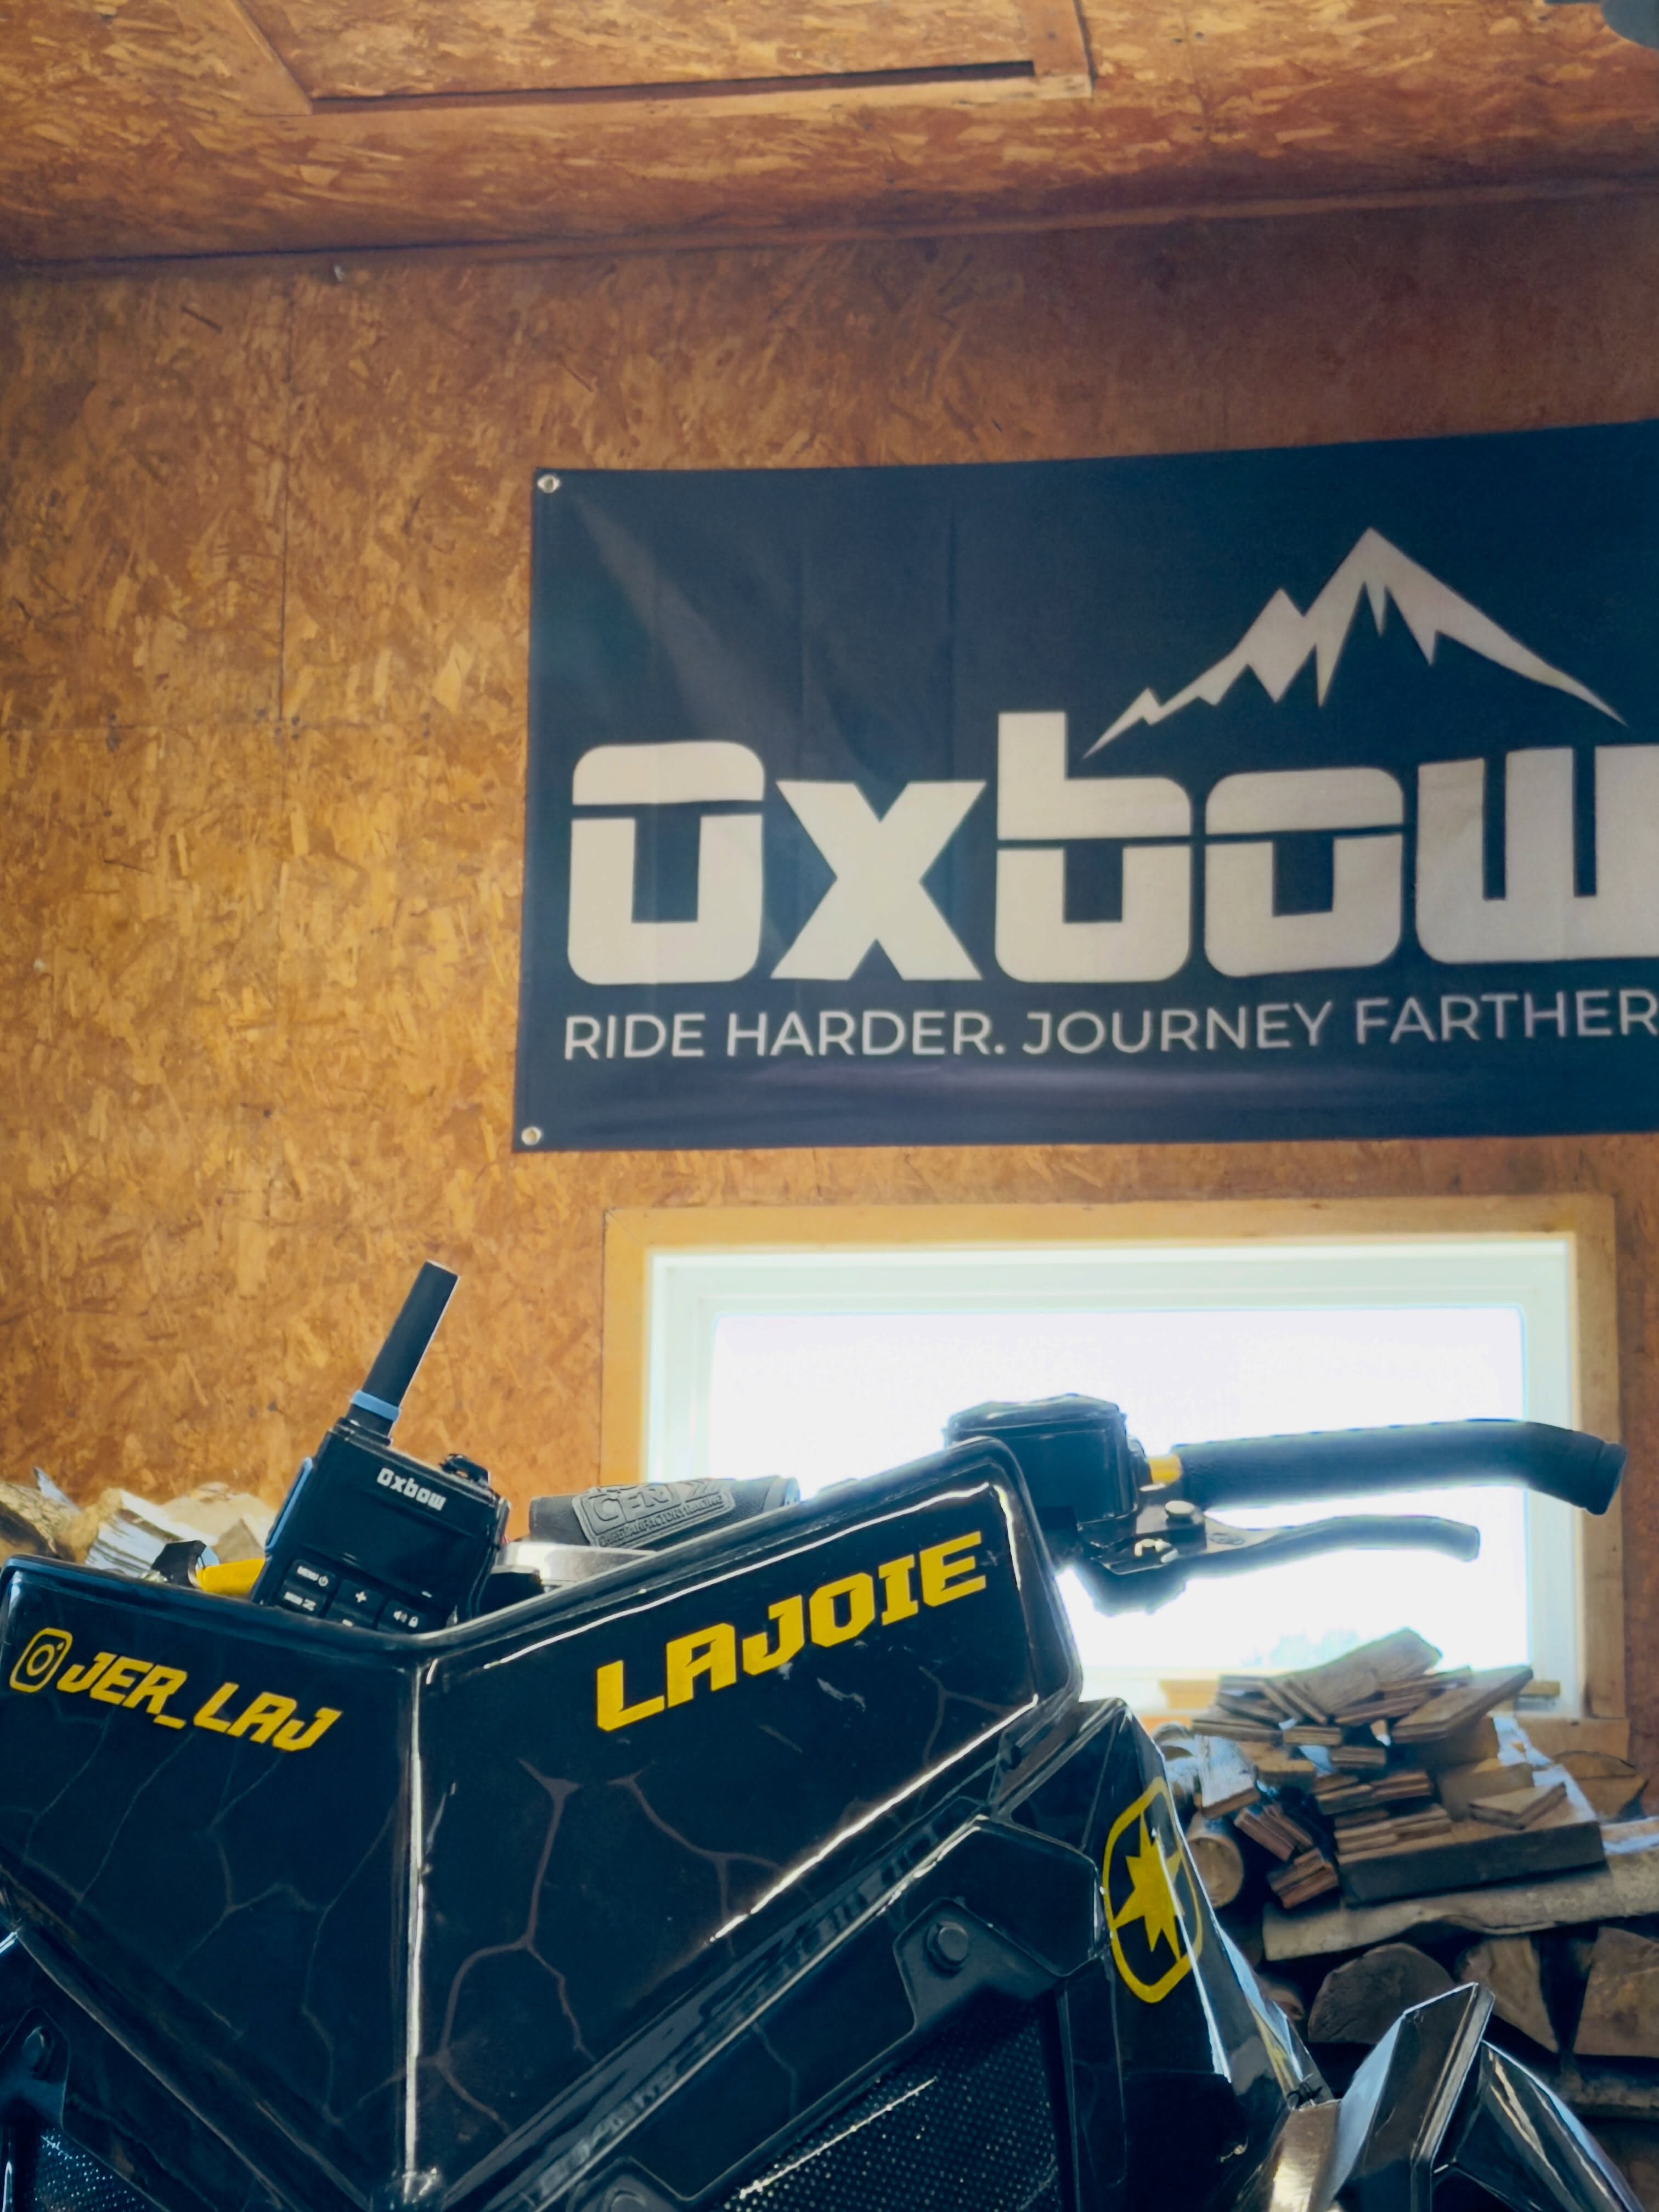
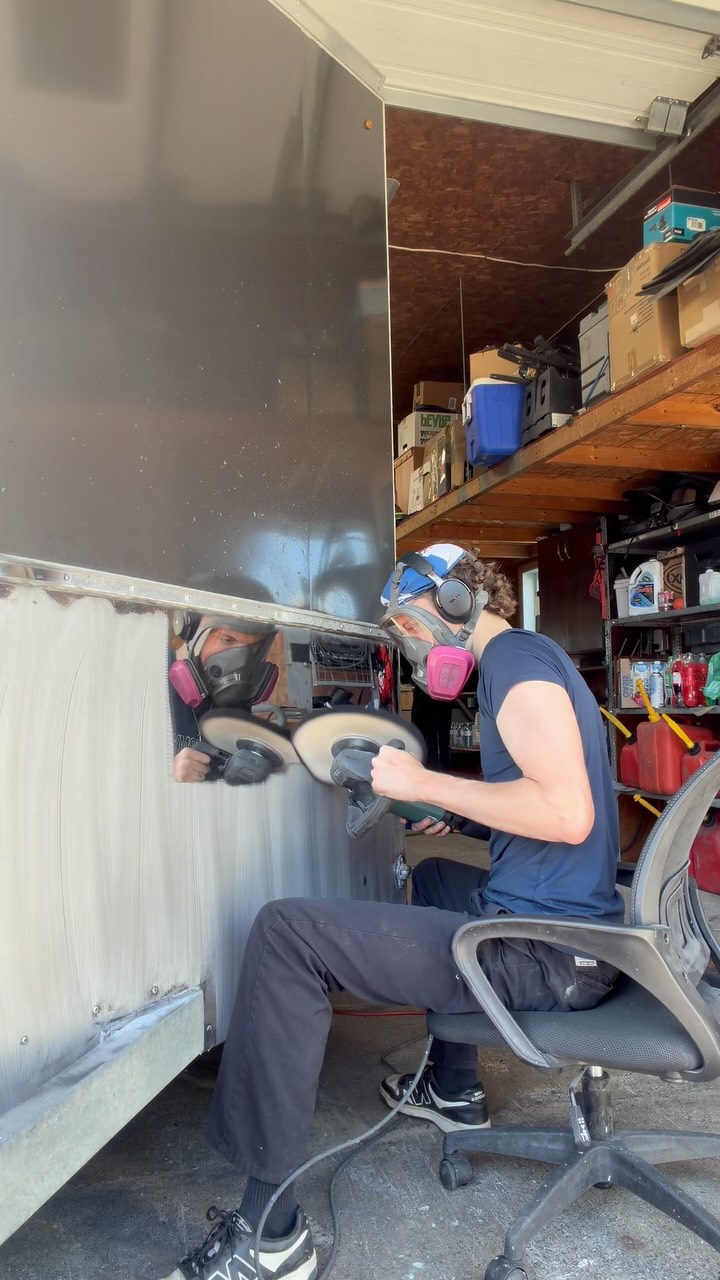
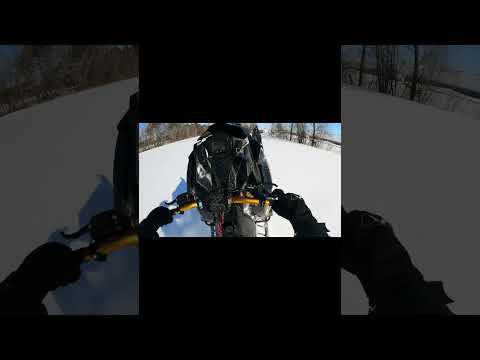
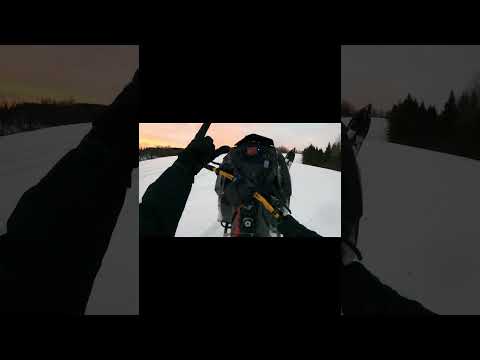
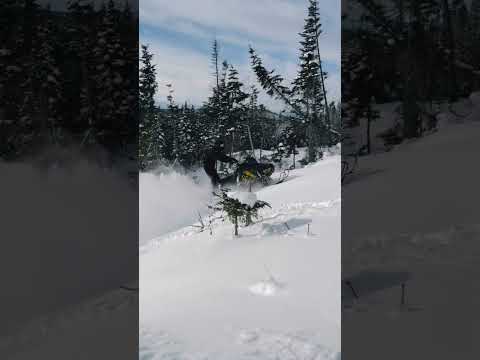
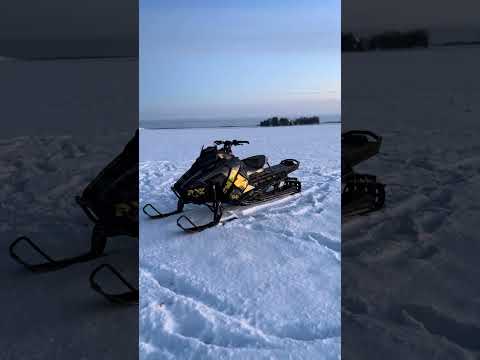
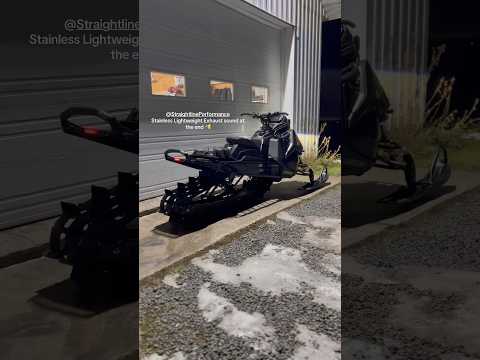
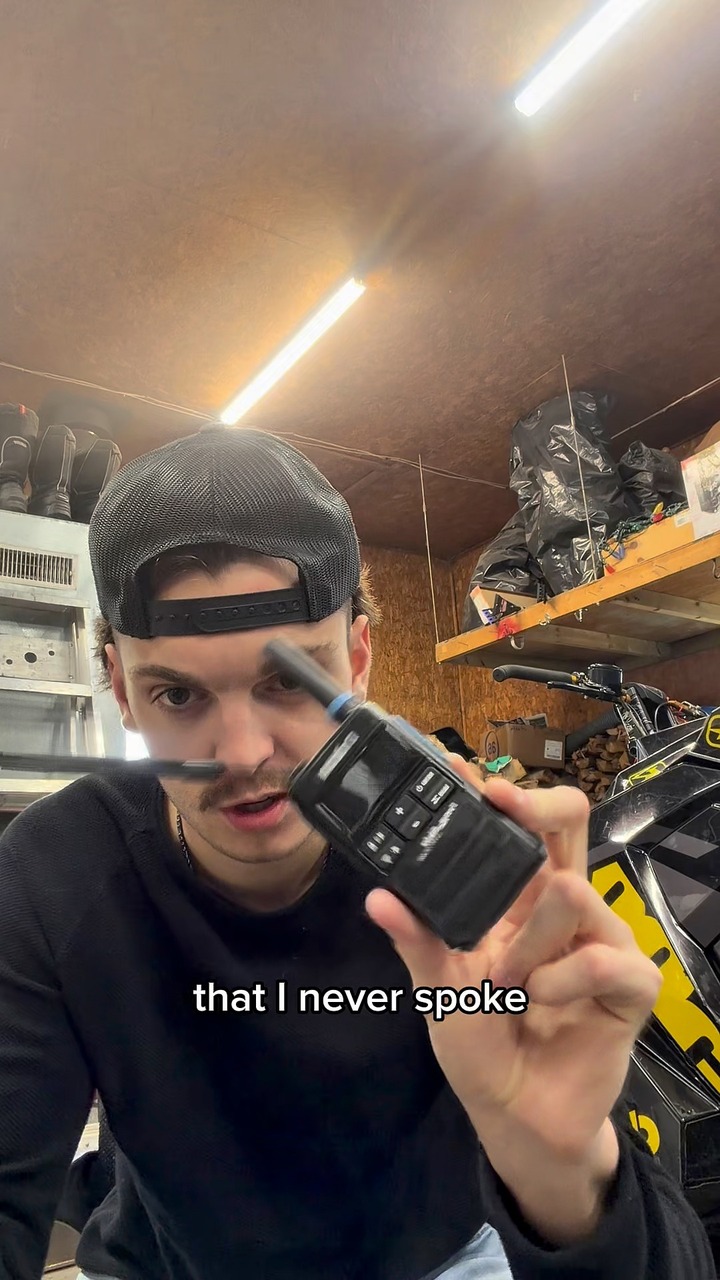
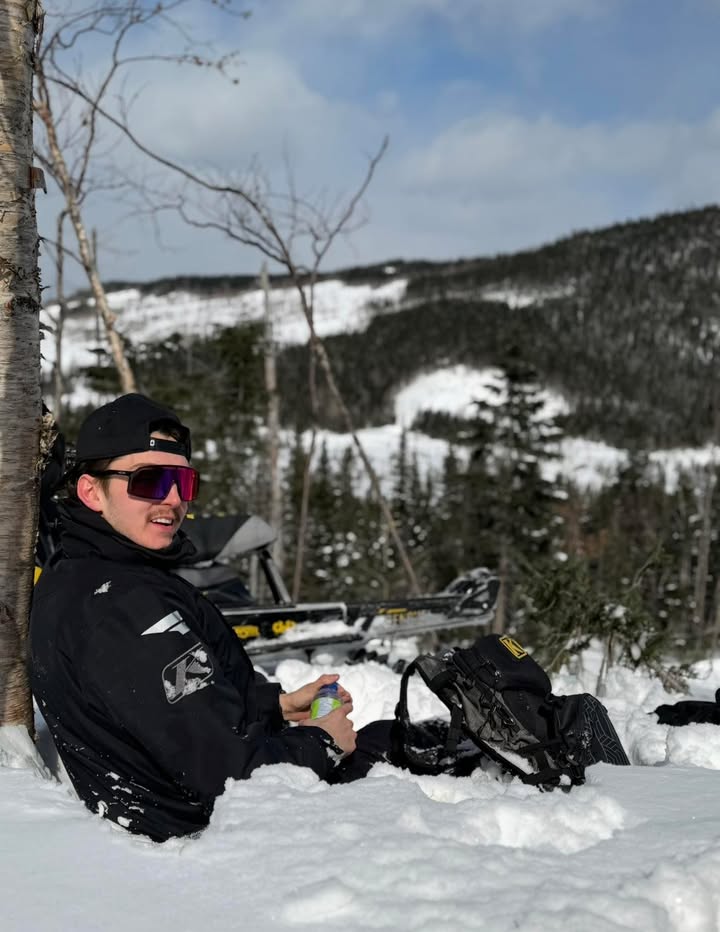
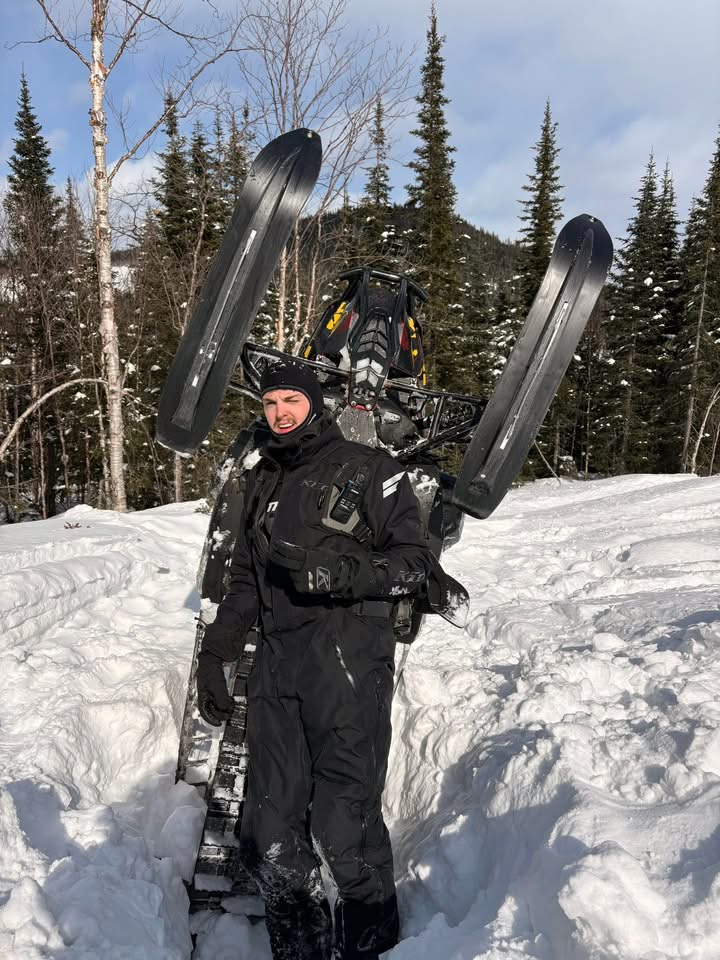
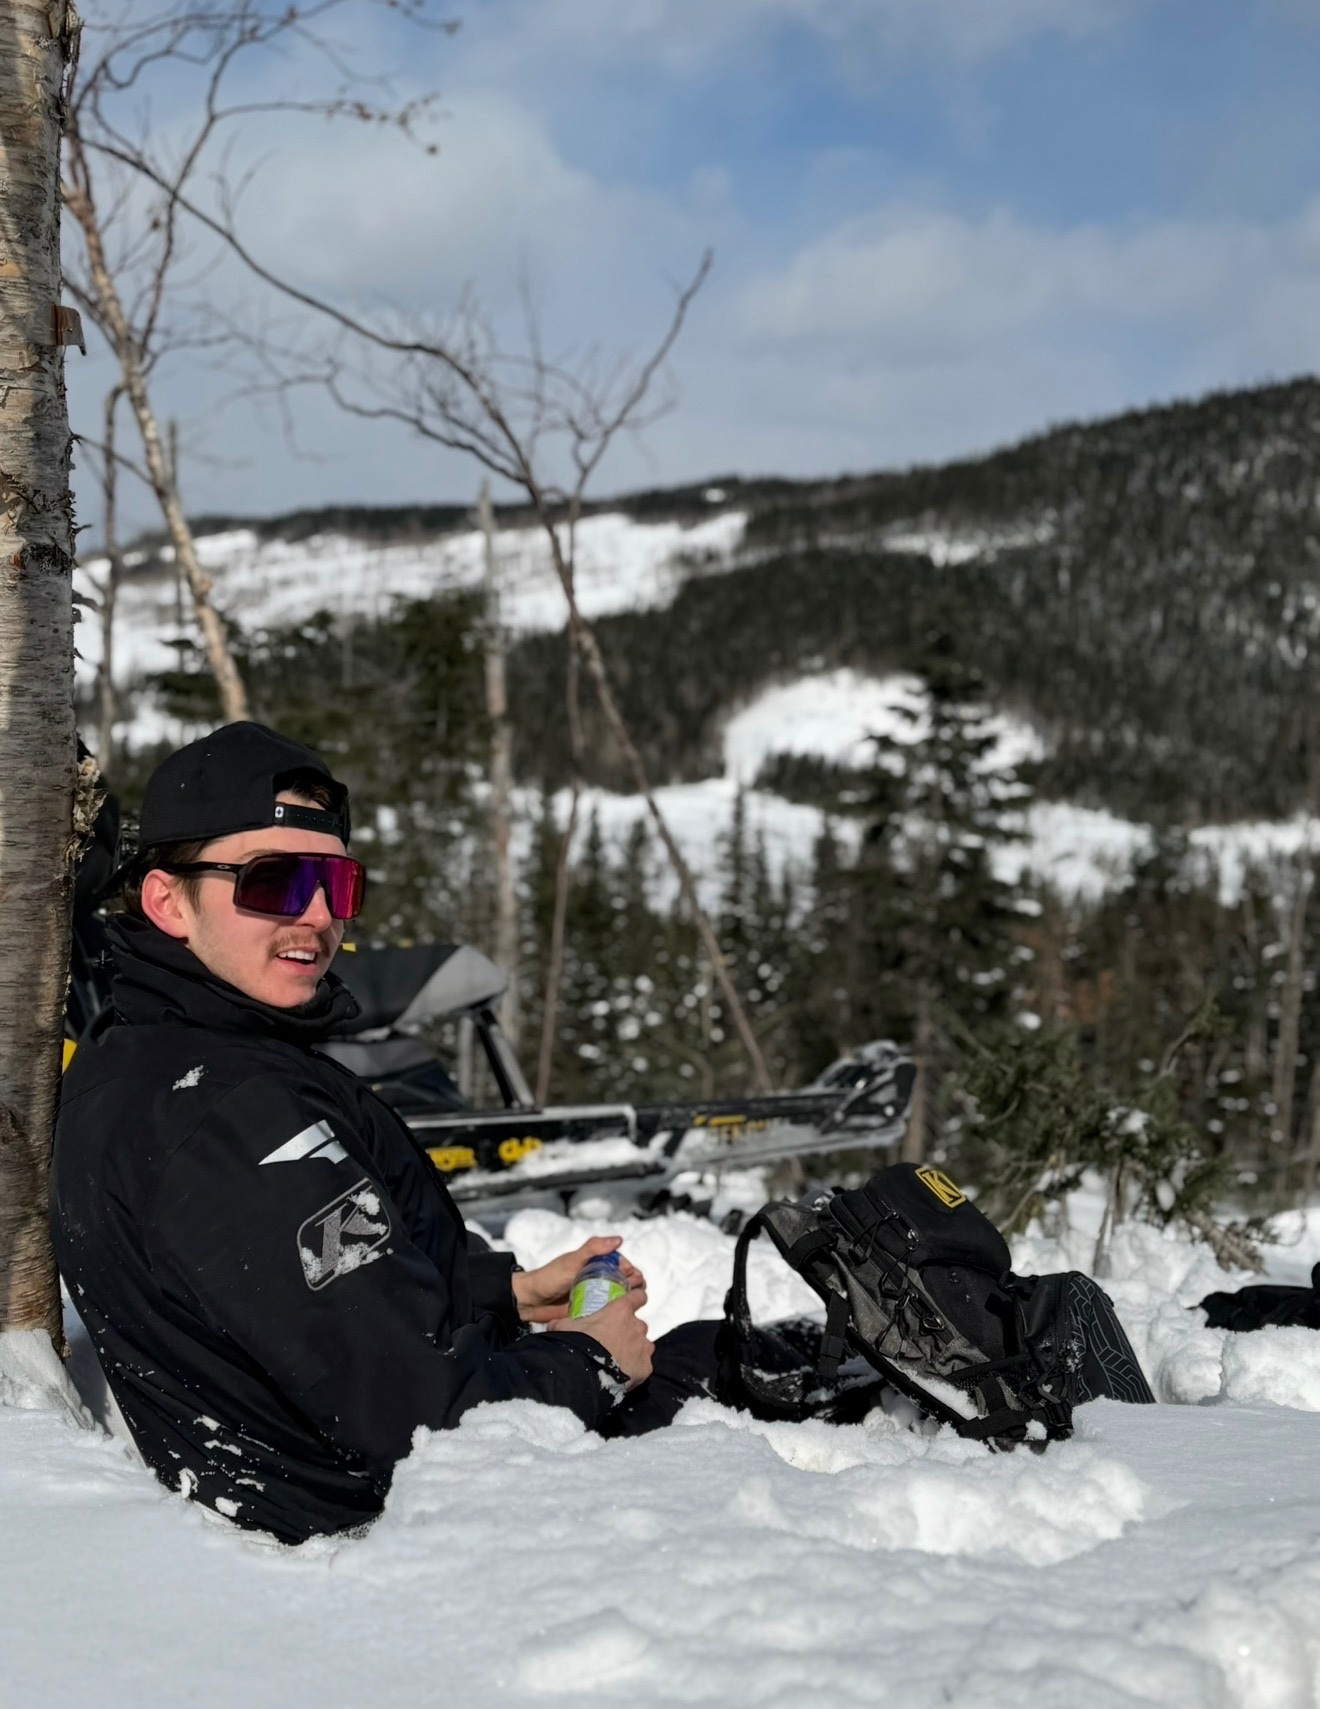
Quebec-based snowmobile and powersports creator sharing real riding, builds, performance upgrades, product testing and mechanical projects. As a mechanical engineering student, I bring a technical and hands-on perspective to the content I create. I focus on authentic brand partnerships, showcasing products in real-world conditions and creating content that resonates with the snowmobile community across Instagram, TikTok and YouTube!
Disciplines
Brand
Polaris
Years
8
Home Spot
Mont Valin
Level
11
Pro
Total XP
25,725
earned
Badges
1
of 23
Campaigns
0
completed
4.9K
Total followers
6.5%
Avg engagement
4
Platforms
416.5K
Total likes
235.8K
Total views (recent)
11.8K
Avg views
21.2
Avg shares
Follower & engagement trend
Follower count and engagement rate over the same period — compare the shape of the two lines.
2 active partnerships
Create a free brand account to pitch Jérémie Lajoie.
Get started freeWeekly averages over the dates shown. Followers are plotted from zero, so the line’s height tracks the actual count; engagement rate is zoomed to its own range, so small moves stay visible. Each panel’s axis endpoints are printed beside it — the two do not share a vertical scale.
71.4K
Total views (recent)
3.8K
Avg views
6.2
Avg shares
2.2
Avg saves
4.6K
Reach (28d)
Follower & engagement trend
Follower count and engagement rate over the same period — compare the shape of the two lines.
Weekly averages over the dates shown. Followers are plotted from zero, so the line’s height tracks the actual count; engagement rate is zoomed to its own range, so small moves stay visible. Each panel’s axis endpoints are printed beside it — the two do not share a vertical scale.
Audience demographics
Age
Gender
4.8K
Total views (recent)
476
Avg views
22m
Watch time (28d)
2:14
Avg view time
18.4%
Avg retention
Follower & engagement trend
Follower count and engagement rate over the same period — compare the shape of the two lines.
Weekly averages over the dates shown. Followers are plotted from zero, so the line’s height tracks the actual count; engagement rate is zoomed to its own range, so small moves stay visible. Each panel’s axis endpoints are printed beside it — the two do not share a vertical scale.
480
Total views (recent)
480
Avg views
Follower & engagement trend
Follower count and engagement rate over the same period — compare the shape of the two lines.
Weekly averages over the dates shown. Followers are plotted from zero, so the line’s height tracks the actual count; engagement rate is zoomed to its own range, so small moves stay visible. Each panel’s axis endpoints are printed beside it — the two do not share a vertical scale.
Top countries