

DAS
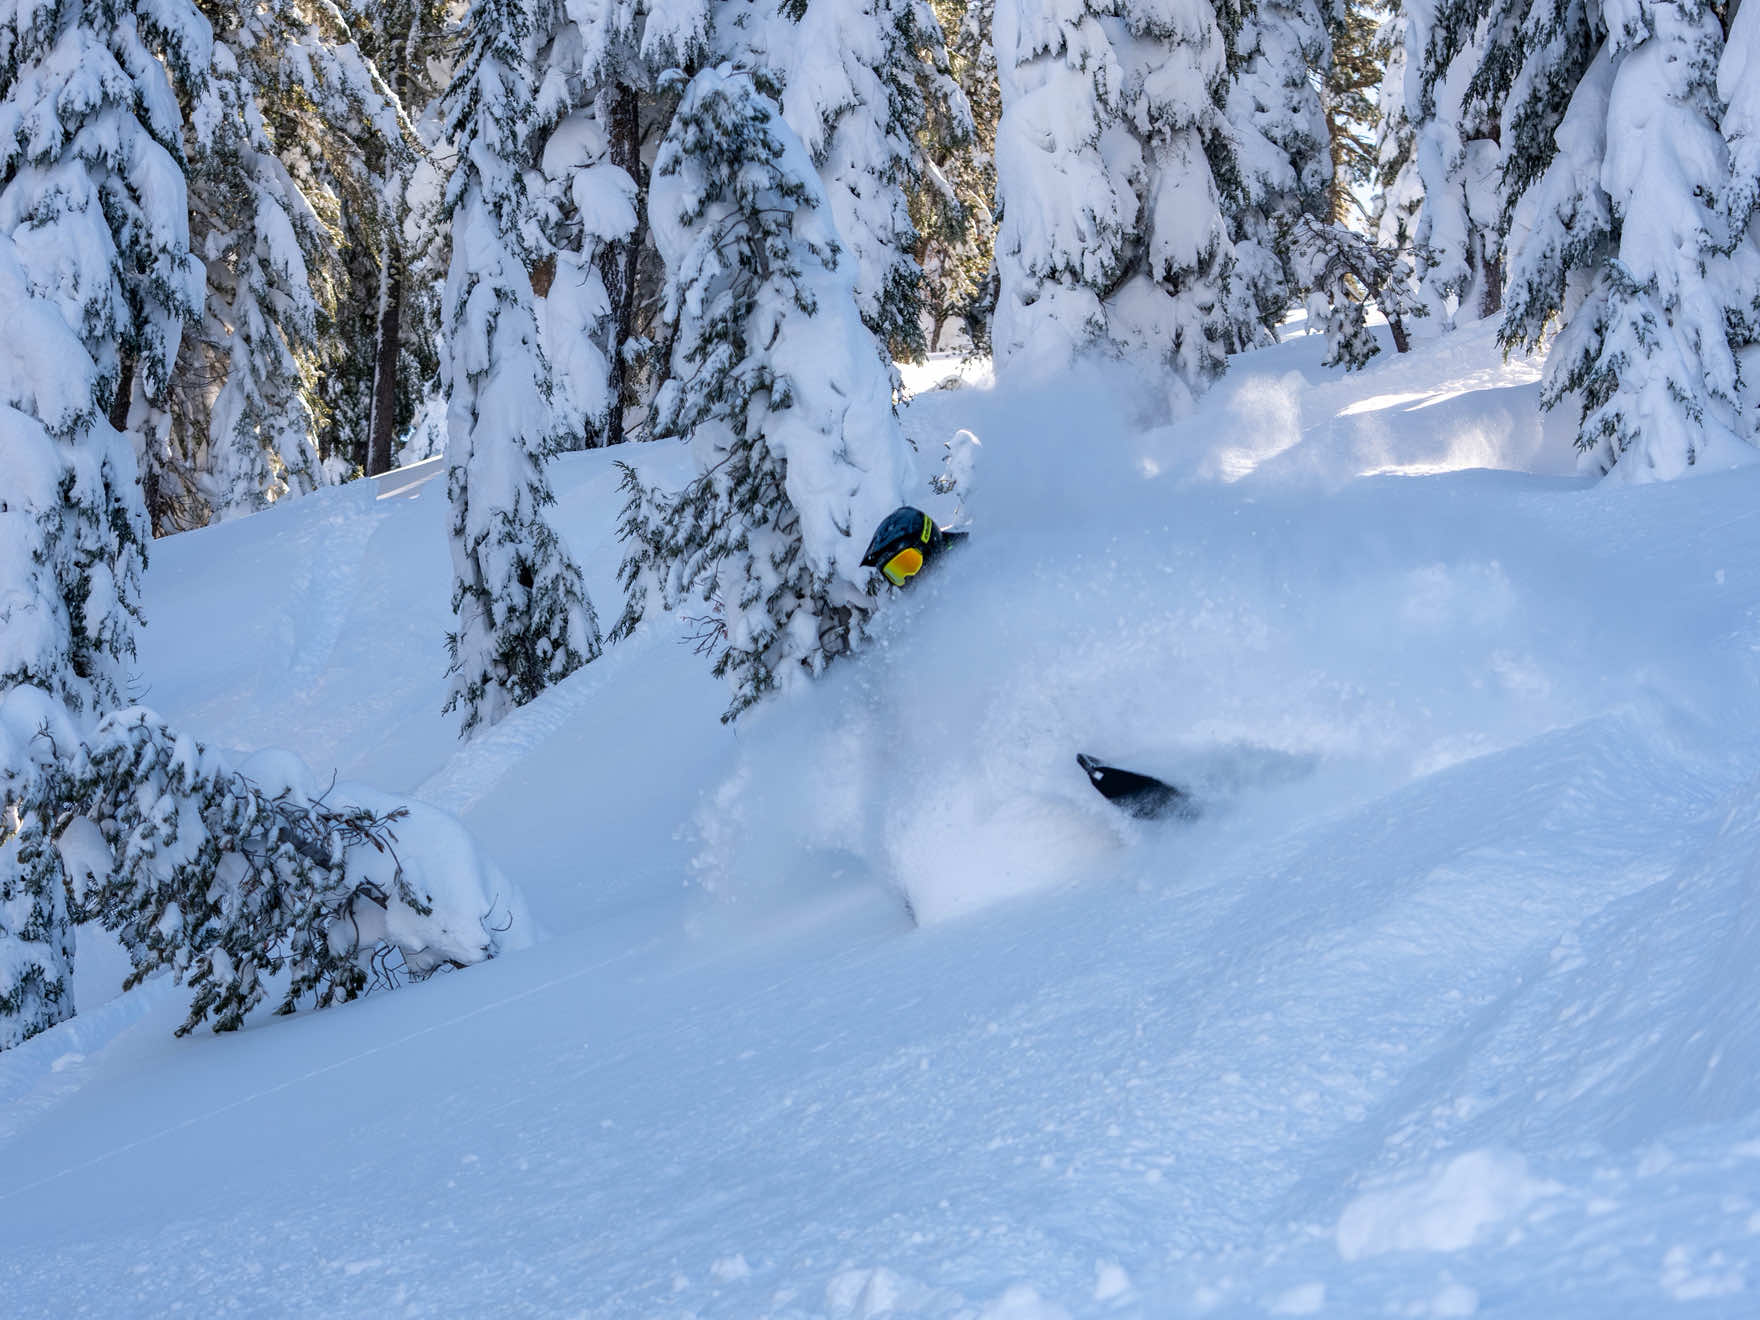
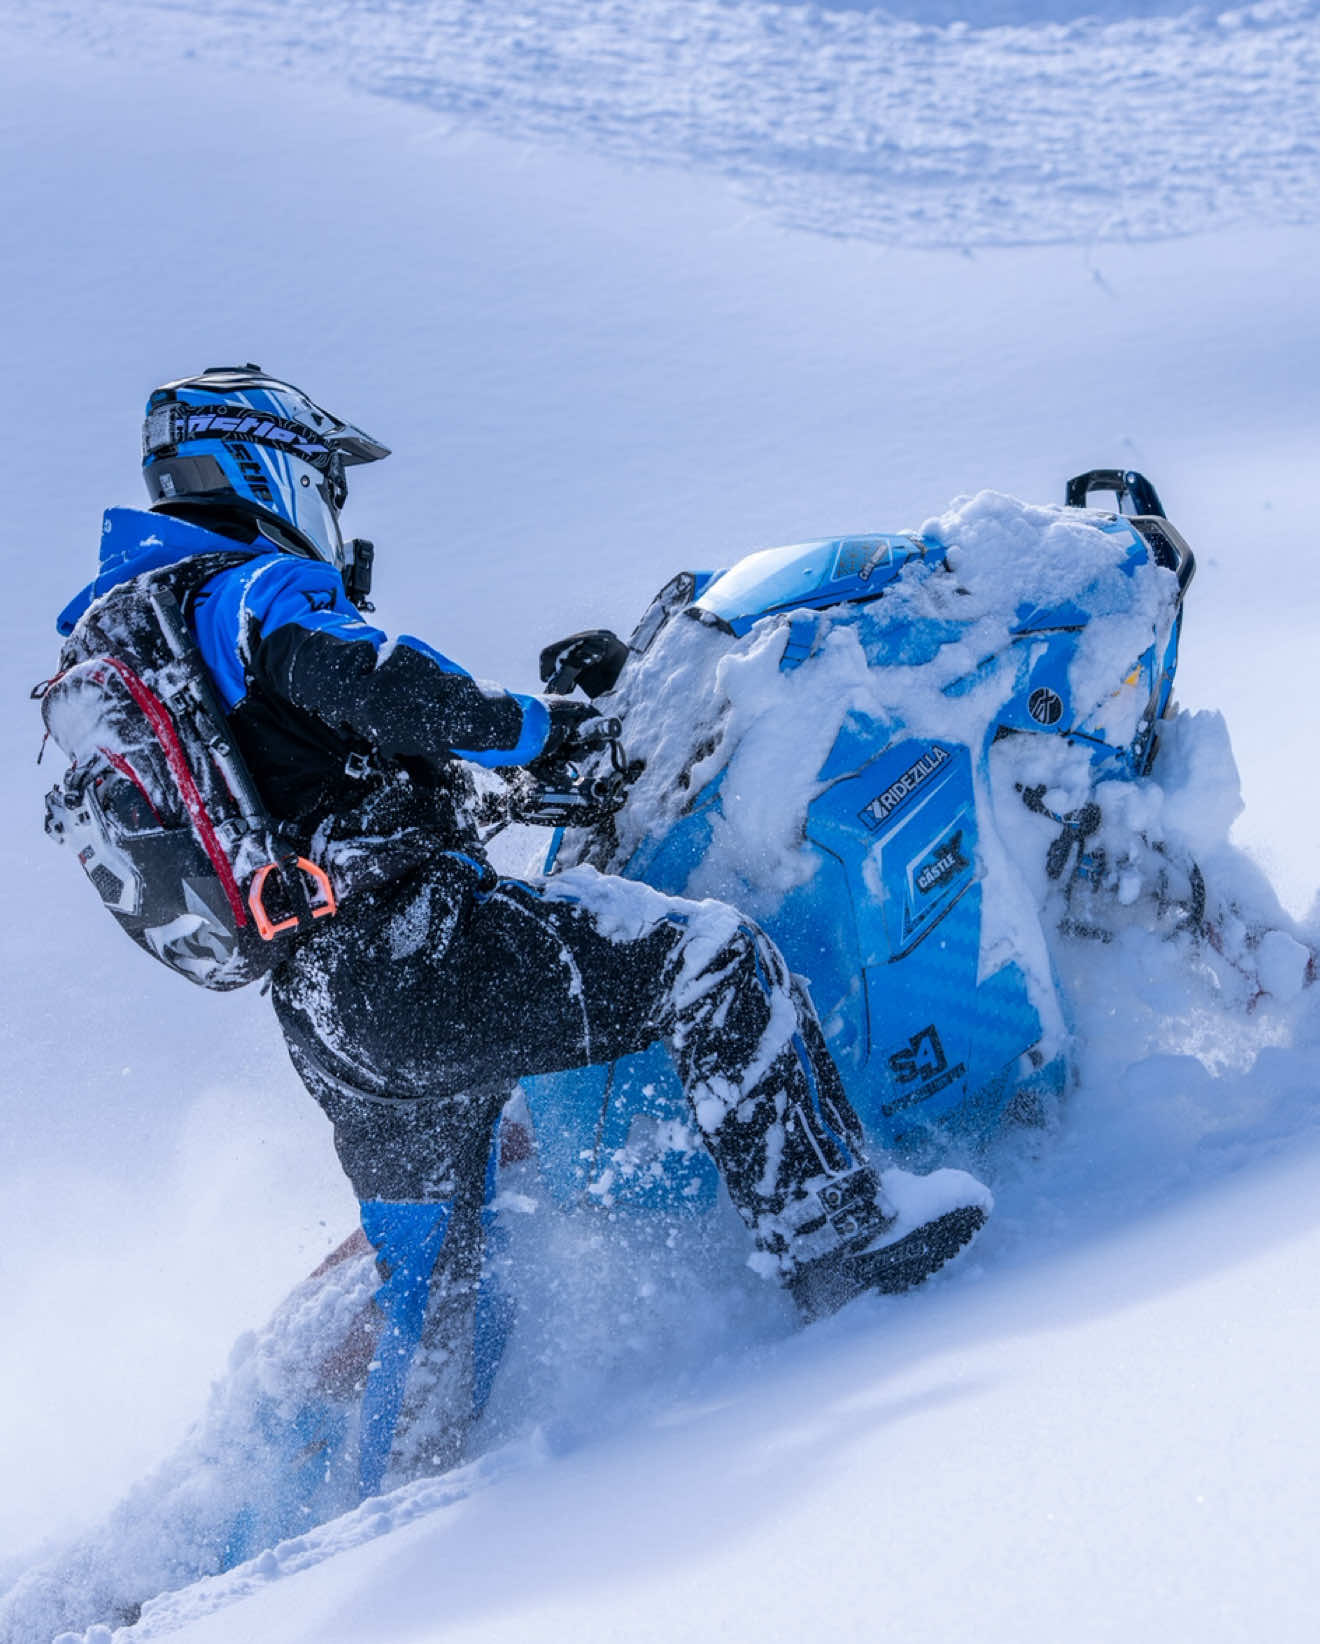
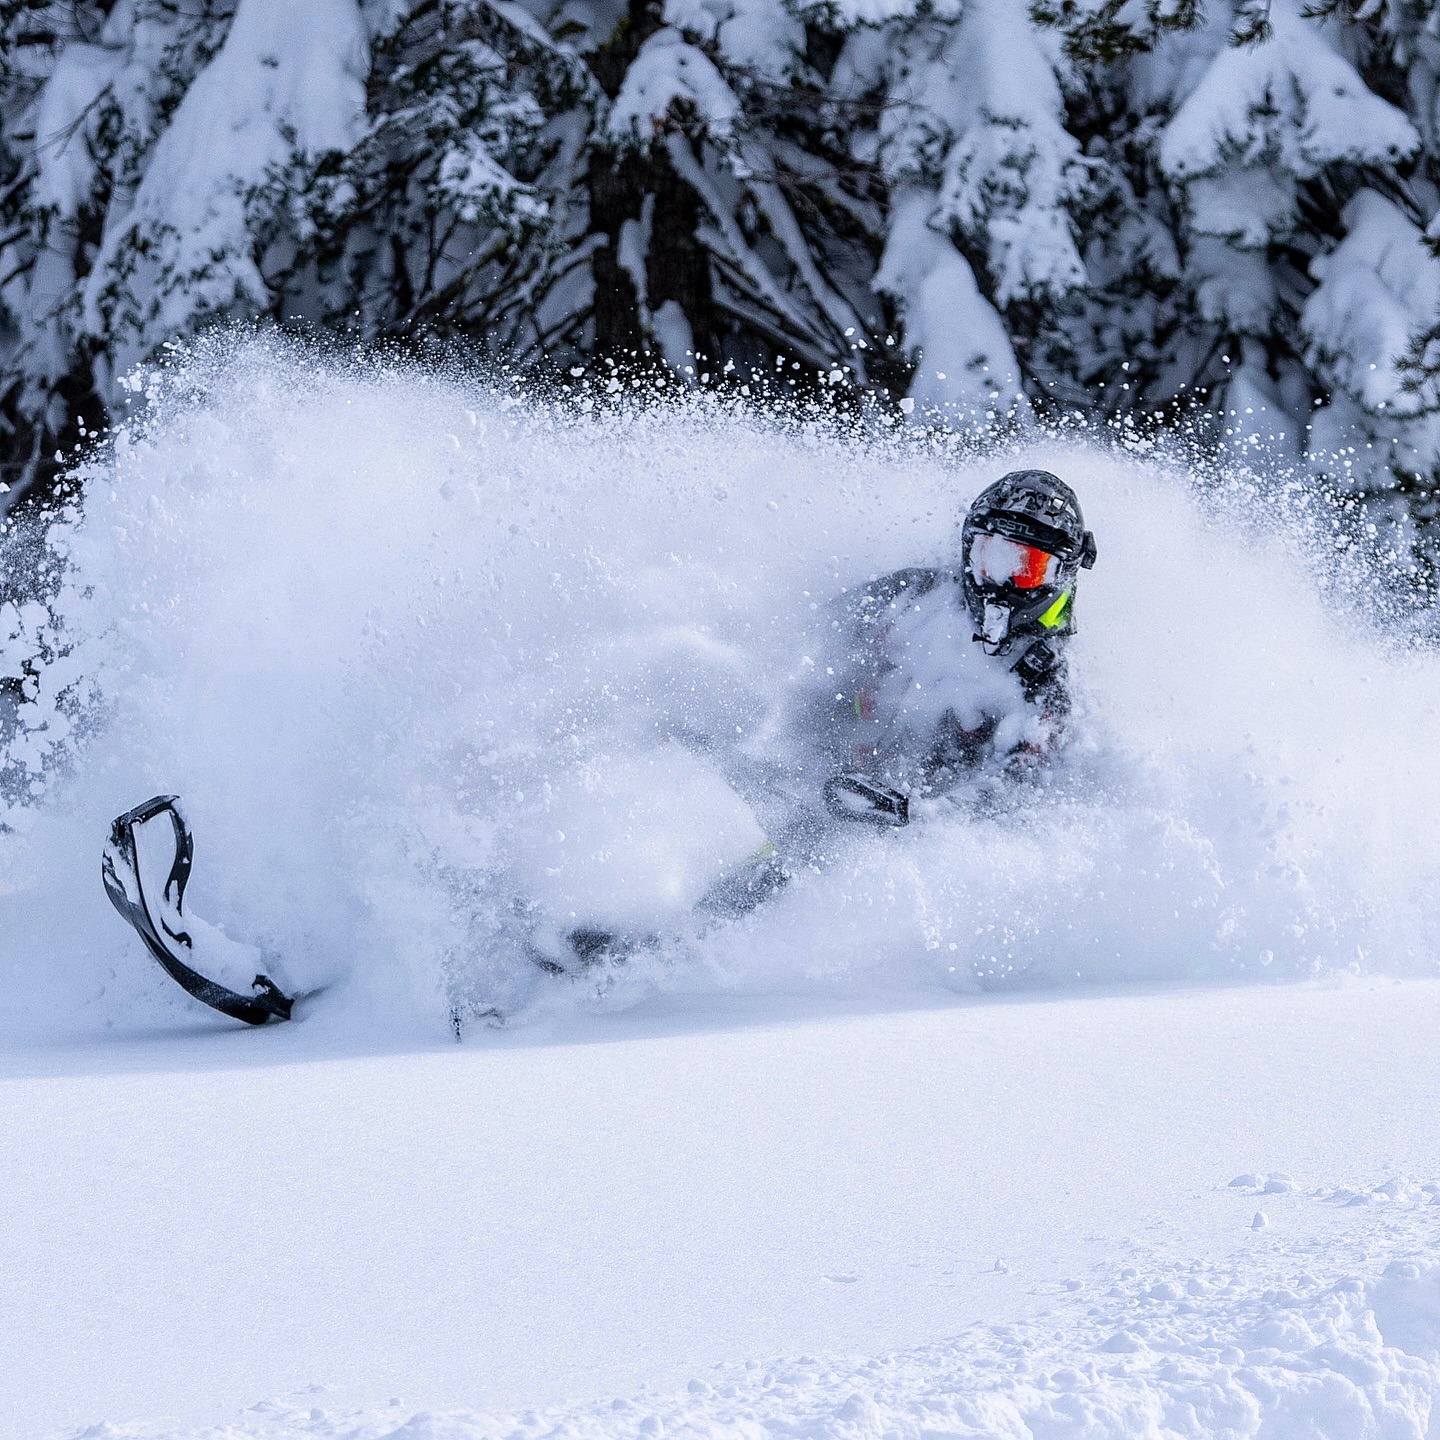
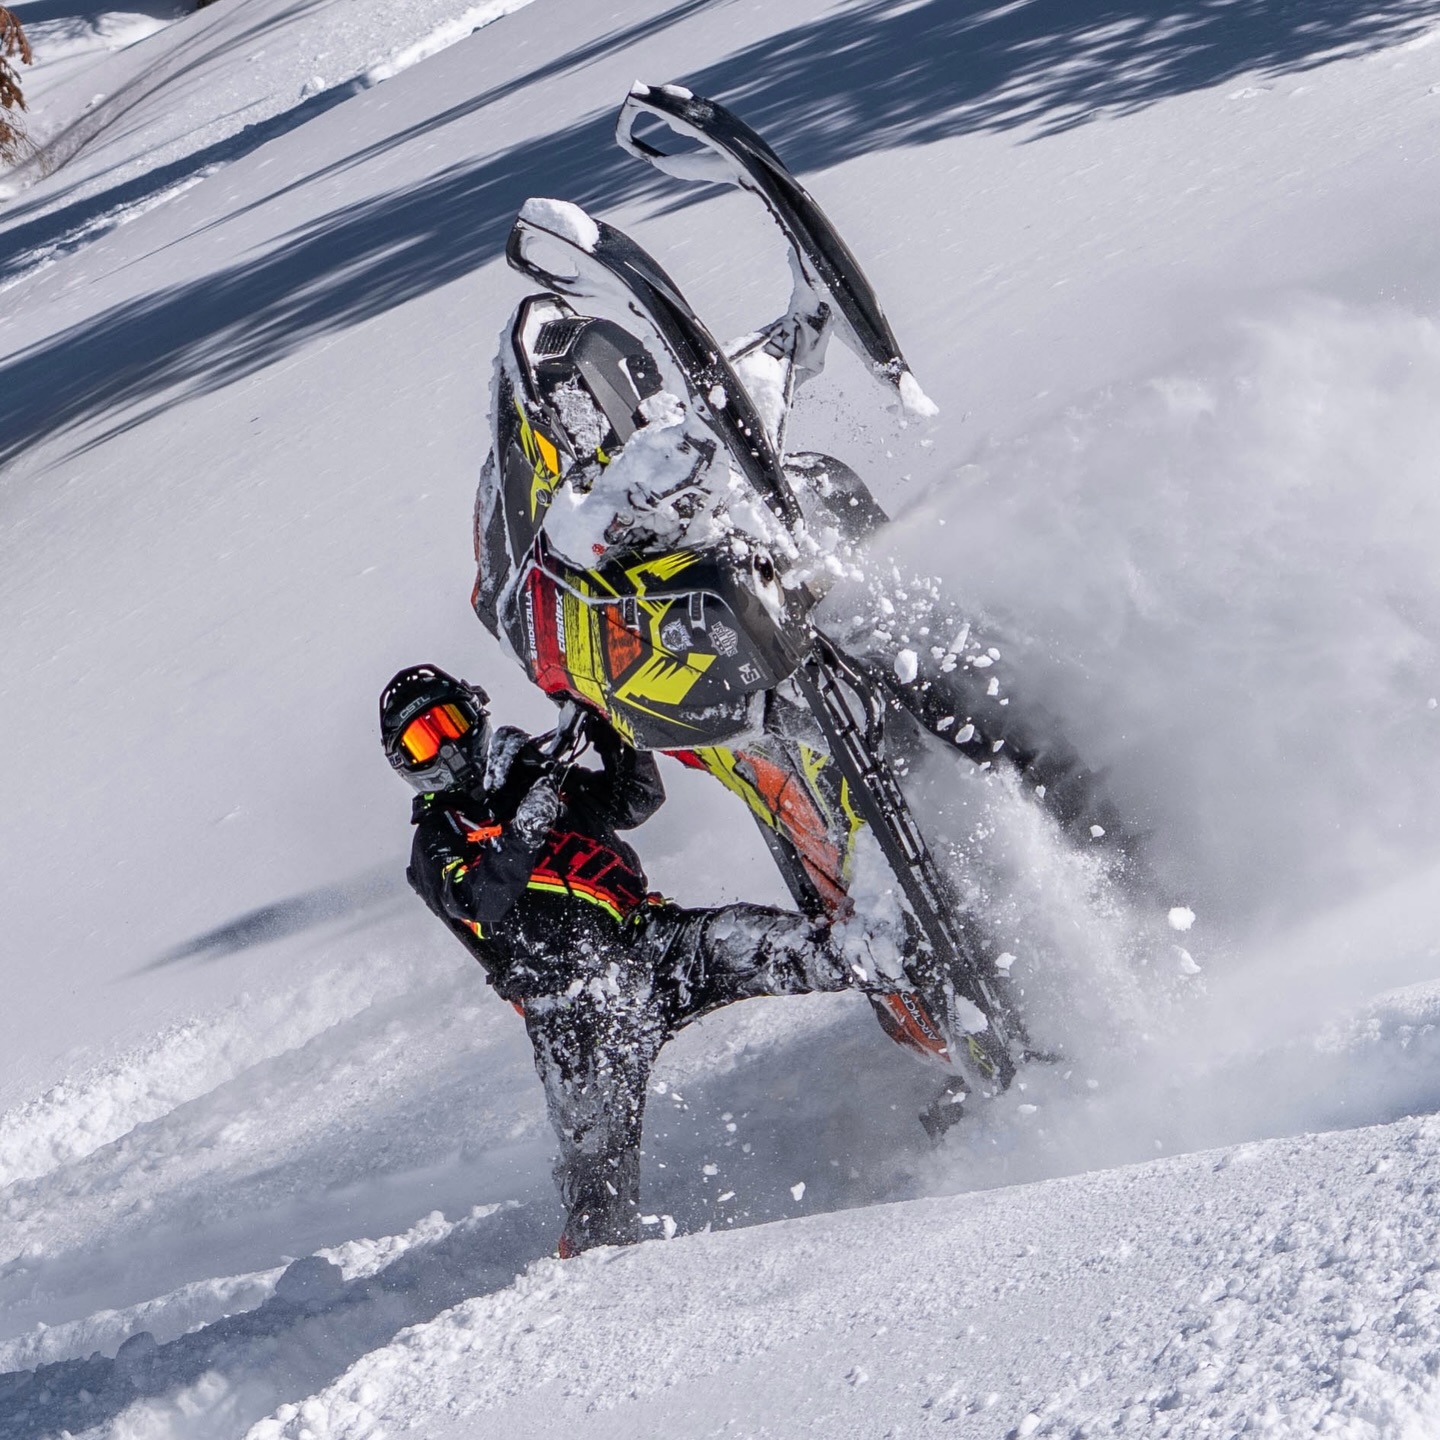
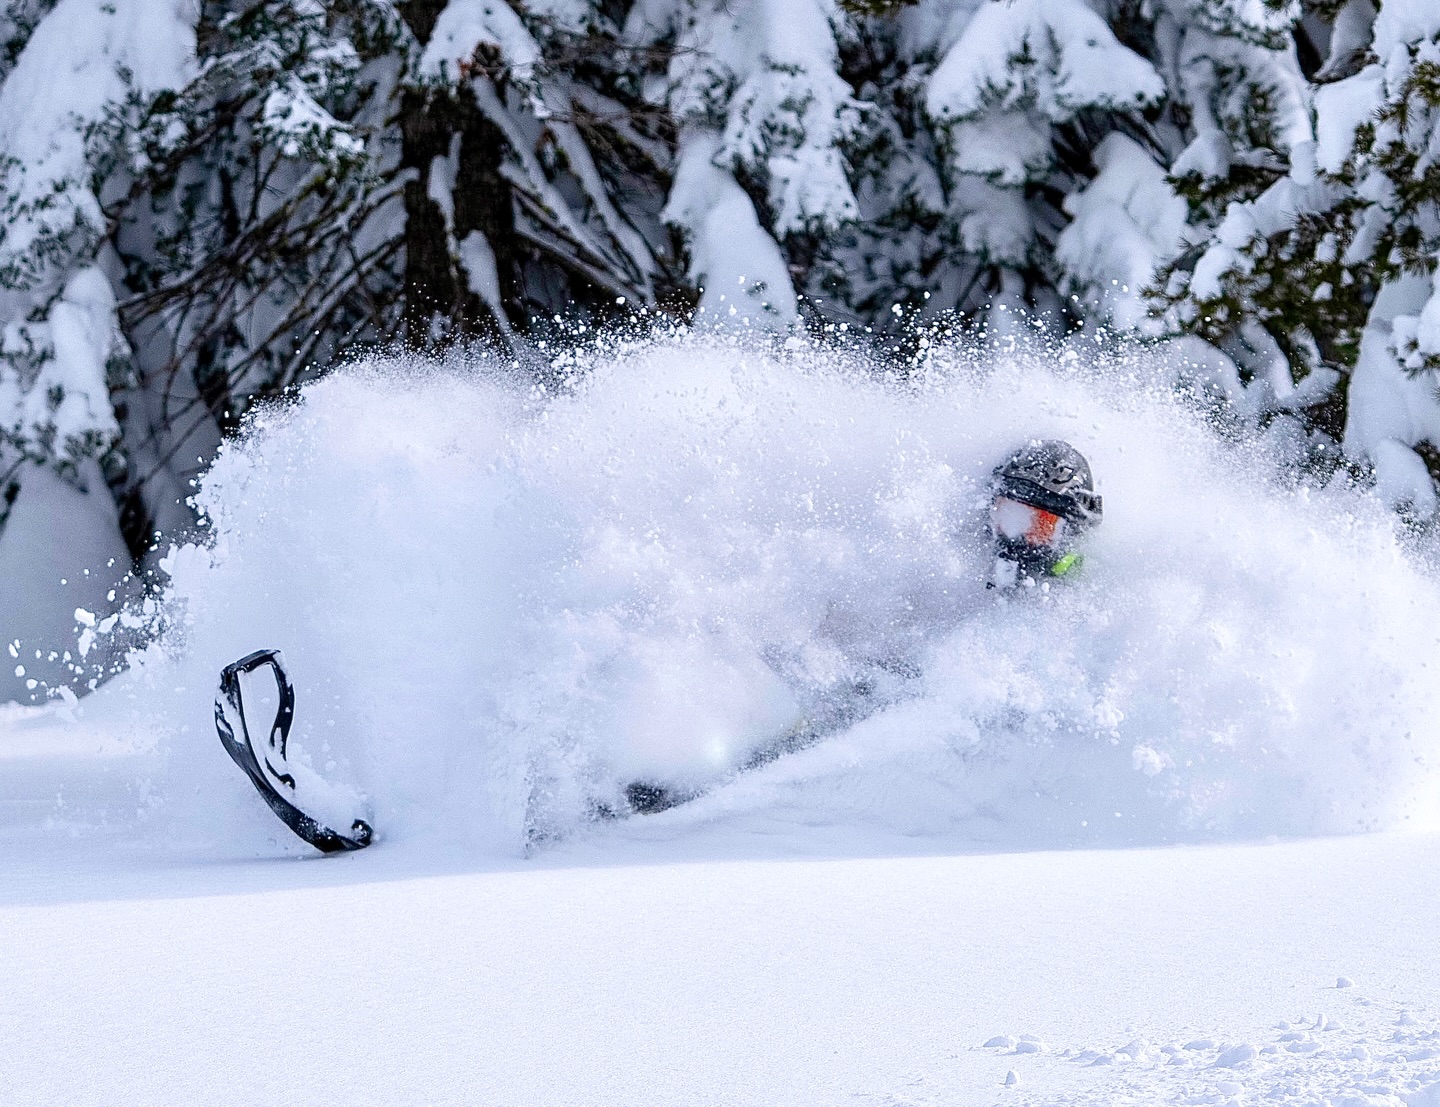
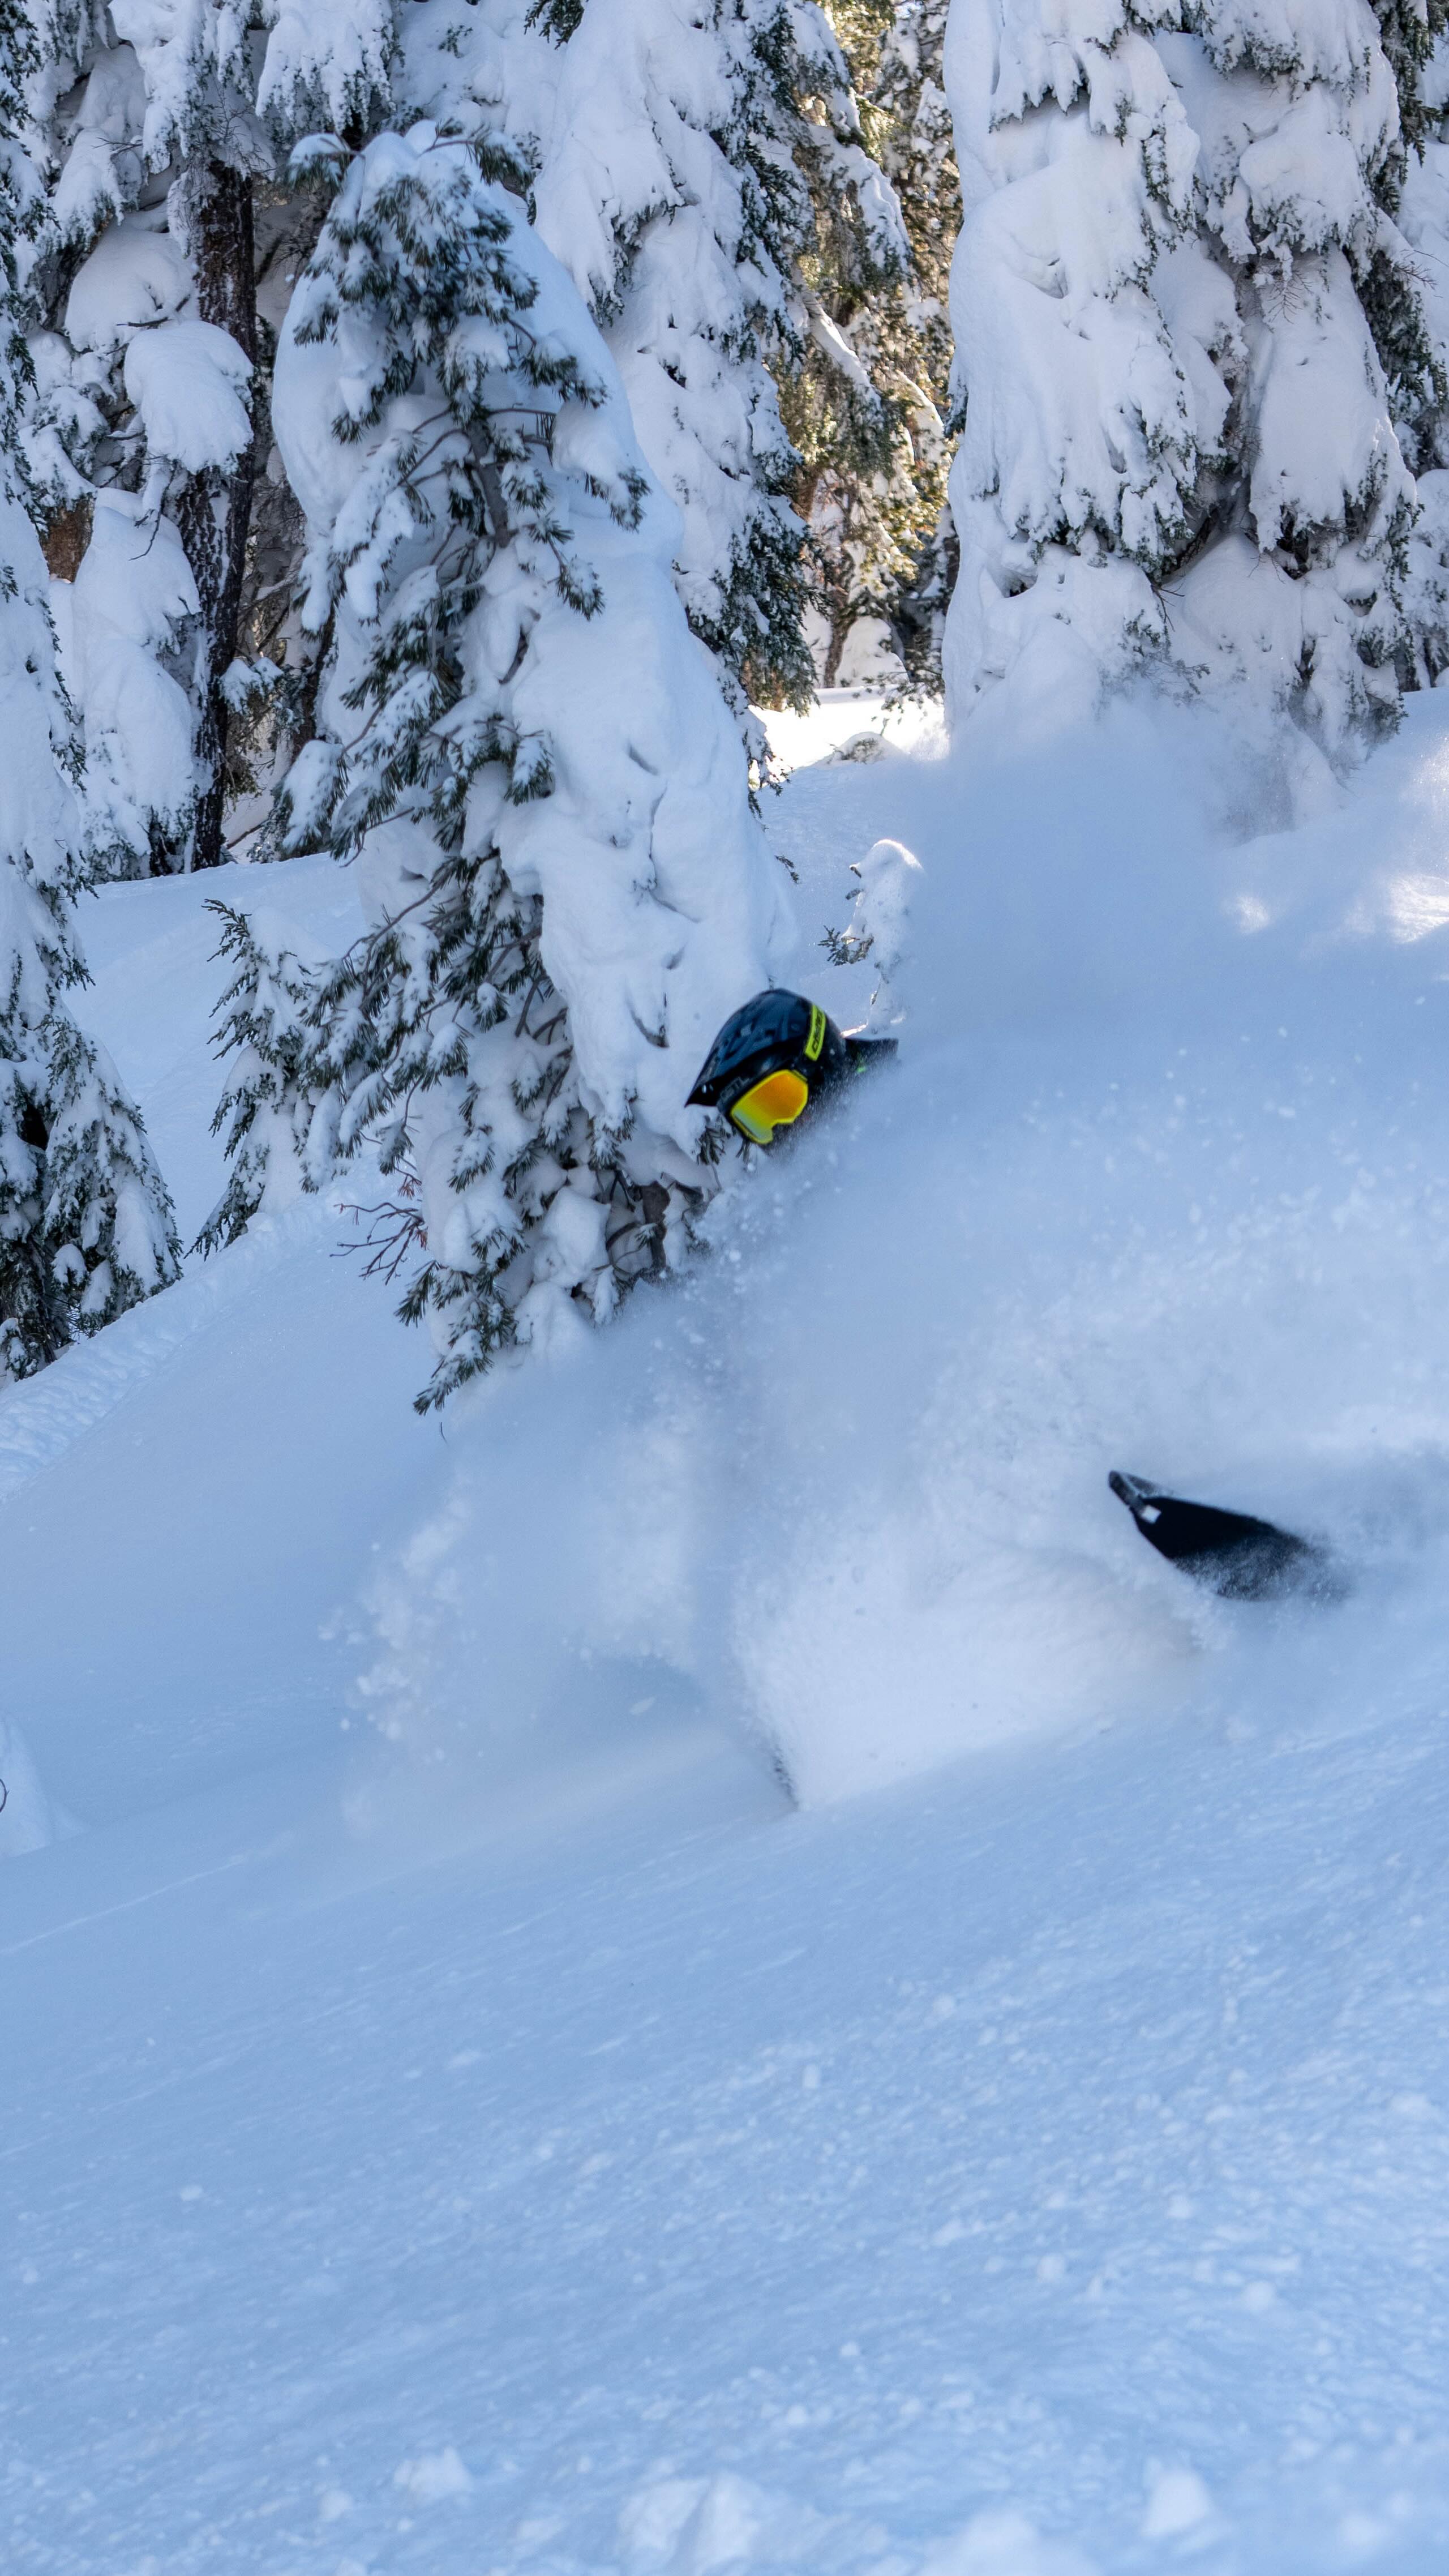
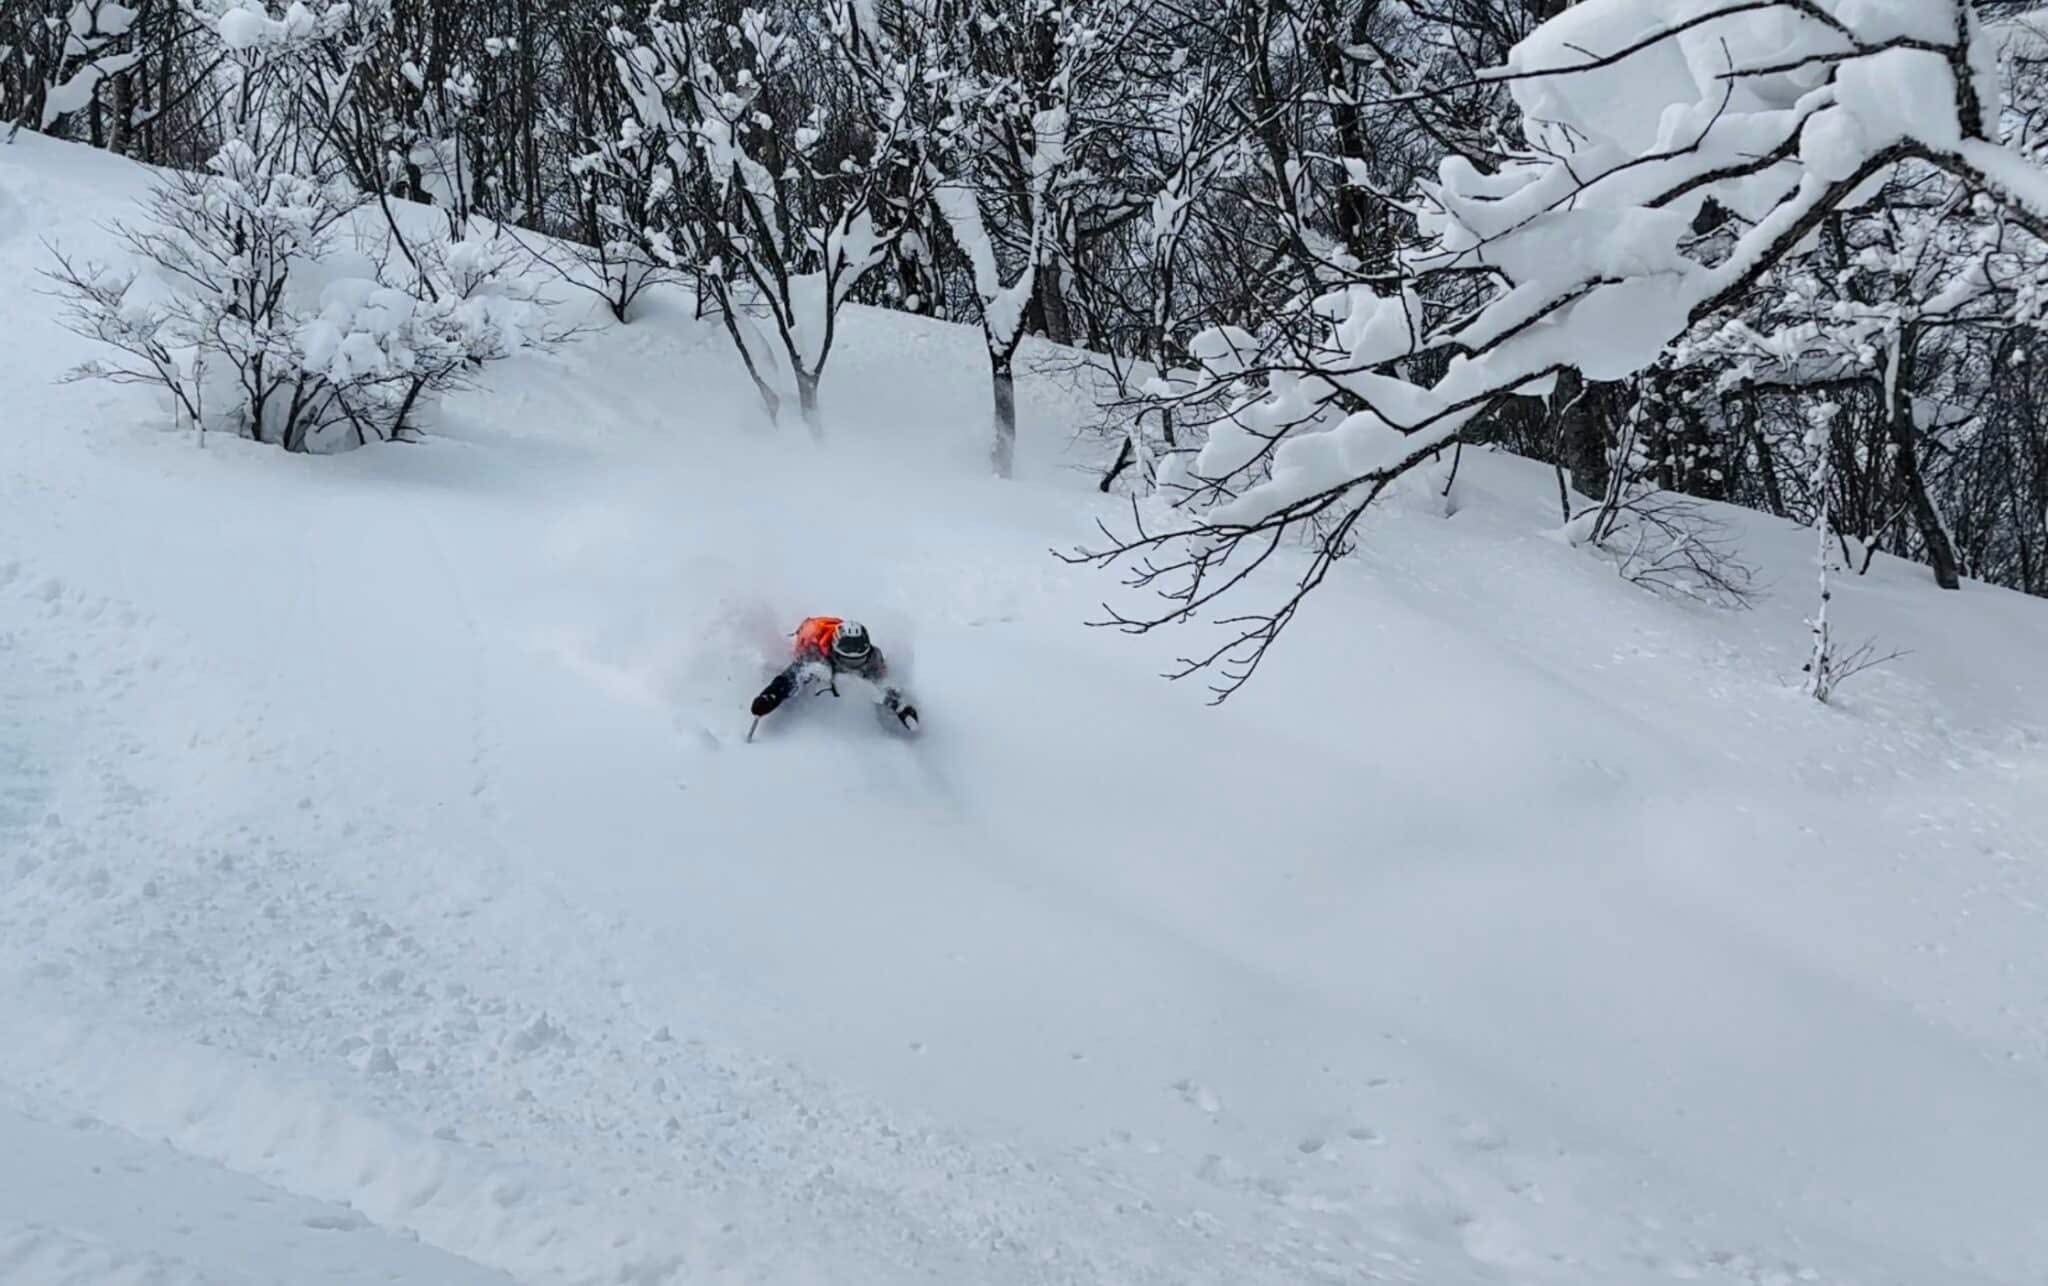
Chris Johnson is a backcountry snowmobiler based in northern Nevada, exploring technical mountain terrain across the western U.S. and Canada. A former professional snowboarder and multiple Red Bull event winner, he transitioned to snowmobiling in 2015. Chris serves on the boards of the Sierra Snowmobile Foundation and Bear Valley Area Riders, promoting responsible riding, public land access, and the future of the sport.
Disciplines
Brand
Ski-Doo
Years
13
Home Spot
Tahoe & Bear Valley
Level
12
Pro
Total XP
28,350
earned
Badges
2
of 23
Campaigns
0
completed
7.2K
Total followers
7.0%
Avg engagement
4
Platforms
38.5K
Total likes
41.2K
Total views (recent)
2.1K
Avg views
3.9
Avg shares
Follower & engagement trend
Follower count and engagement rate over the same period — compare the shape of the two lines.
3 active partnerships
Sierra Snowmobile Foundation
Marketing Director
Bear Valley Riders
Marketing Director
Create a free brand account to pitch Chris Johnson.
Get started freeWeekly averages over the dates shown. Followers are plotted from zero, so the line’s height tracks the actual count; engagement rate is zoomed to its own range, so small moves stay visible. Each panel’s axis endpoints are printed beside it — the two do not share a vertical scale.
74.1K
Total views (recent)
8.2K
Avg views
2.9
Avg shares
1.2
Avg saves
1.8K
Reach (28d)
Follower & engagement trend
Follower count and engagement rate over the same period — compare the shape of the two lines.
Weekly averages over the dates shown. Followers are plotted from zero, so the line’s height tracks the actual count; engagement rate is zoomed to its own range, so small moves stay visible. Each panel’s axis endpoints are printed beside it — the two do not share a vertical scale.
Audience demographics
Age
Gender
Follower & engagement trend
Follower count and engagement rate over the same period — compare the shape of the two lines.
Weekly averages over the dates shown. Followers are plotted from zero, so the line’s height tracks the actual count; engagement rate is zoomed to its own range, so small moves stay visible. Each panel’s axis endpoints are printed beside it — the two do not share a vertical scale.
596
Avg views
14m
Watch time (28d)
0:48
Avg view time
22.5%
Avg retention
Follower & engagement trend
Follower count and engagement rate over the same period — compare the shape of the two lines.
Weekly averages over the dates shown. Followers are plotted from zero, so the line’s height tracks the actual count; engagement rate is zoomed to its own range, so small moves stay visible. Each panel’s axis endpoints are printed beside it — the two do not share a vertical scale.
Top countries